Published Nov 20, 2026 · Updated Nov 20, 2026 · 20 min read
Customer Service KPIs: 18 Metrics That Still Matter When AI Handles Half the Queue (2026)
18 customer service KPIs defined for a team where an AI agent takes the first contact: the exact formula, what each one tells you, how AI distorts it, who owns it and a worked example, plus a scorecard with review cadence, KPIs by role and the vanity metrics to drop.
 Written by Andrew Hall, Editor
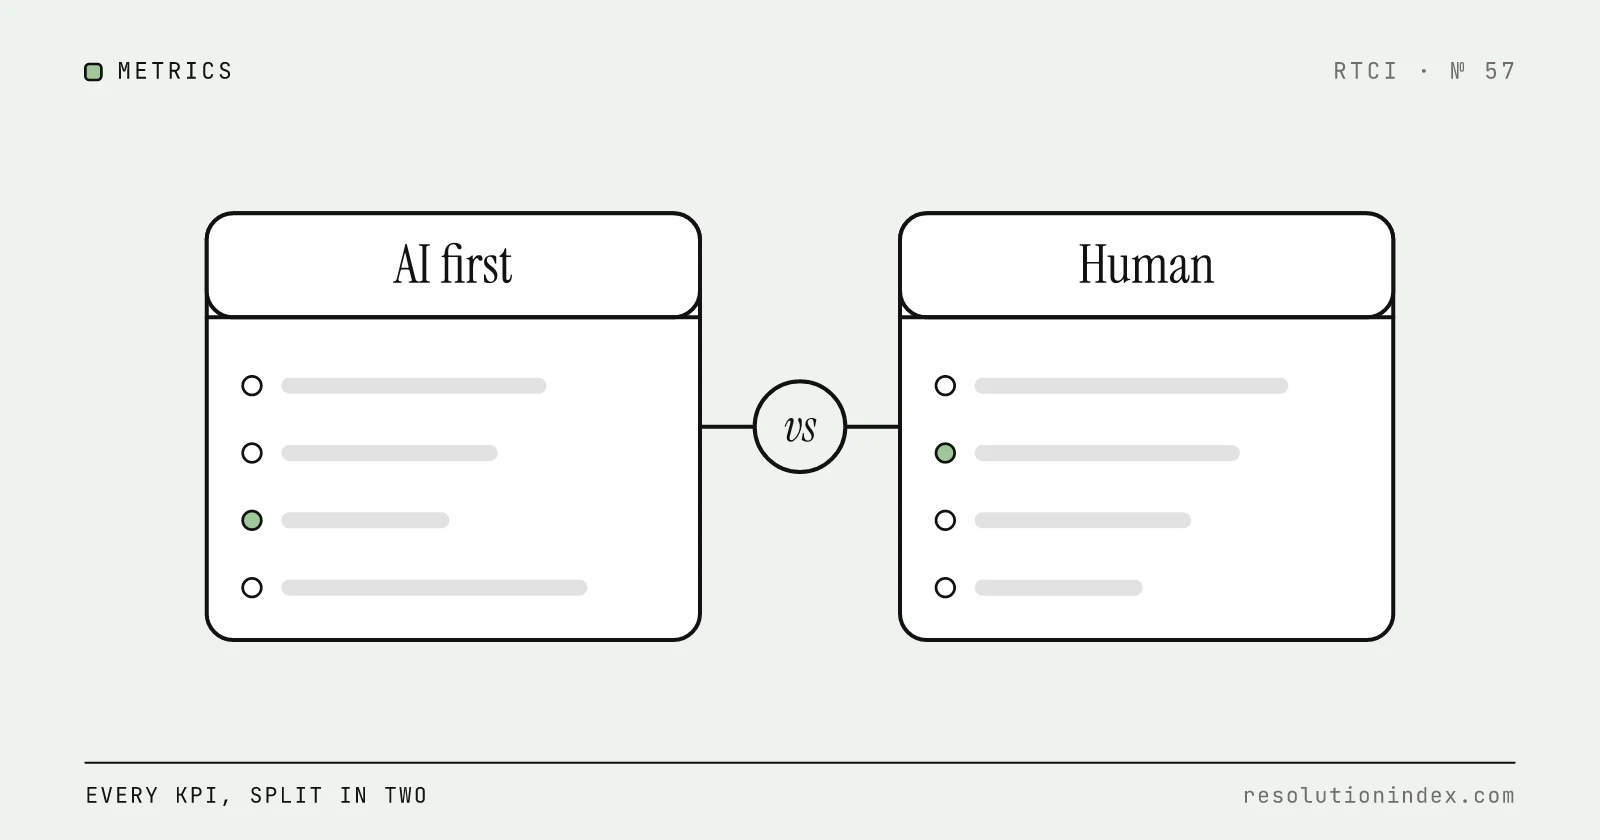
The customer service KPIs worth running in 2026 are the 18 below, from first response time to agent attrition, each with an exact formula, an owner and a review cadence. What AI changes is that almost every one has to be reported in two halves. Once an AI agent takes the easy tickets, human AHT rises, blended FCR depends on how you count handoffs, CSAT comes from a different set of respondents, and cost per ticket falls even while each human contact gets more expensive. Split each KPI by AI and human, and anchor the set on cost per verified resolution.
Each entry gives the formula, what it tells you, how AI distorts it, who owns it and, where it helps, a labelled worked example built on one hypothetical month. Benchmarks appear only where a primary source publishes one with its method; everywhere else the target comes from your own baseline. Calculators and RTCI deep dives are linked from each entry.
The customer service KPI scorecard
Copy this into your reporting doc. Every formula is reported for three cohorts unless the row says otherwise: AI only (the AI closed it with no handoff), AI to human (the AI started and a person finished), and human only (routed straight to a person).
| # | KPI | Formula | Owner | Review cadence |
|---|---|---|---|---|
| 1 | First response time (FRT) | Median of (first reply time − created time), per first responder | Team lead | Daily |
| 2 | Resolution time | Median of (final resolved time − created time) | Team lead | Weekly |
| 3 | Average handle time (AHT) | (Talk or chat time + hold time + after-contact work) ÷ handled contacts | Team lead | Weekly |
| 4 | First contact resolution (FCR) | Issues resolved on the first contact ÷ all issues × 100 | Team lead | Weekly |
| 5 | Verified AI resolution rate | (AI-closed conversations − those re-contacted within 72 hours) ÷ conversations that reached the AI × 100 | Head of support | Weekly |
| 6 | Containment and deflection | AI conversations ended without a person ÷ AI conversations × 100; self-service sessions with no ticket ÷ inbound attempts × 100 | Head of support (diagnostic only) | Monthly |
| 7 | Escalation rate | AI-to-human handoffs ÷ conversations that reached the AI × 100 | Team lead or AI owner | Weekly |
| 8 | 72-hour re-contact rate | Resolved issues with a same-issue contact within 72 hours ÷ resolved issues × 100 | Agent (own tickets), team lead | Weekly |
| 9 | Backlog age | Open tickets older than your threshold ÷ open tickets × 100, plus the median age | Team lead | Daily |
| 10 | SLA attainment | Tickets that met the target ÷ tickets under that SLA × 100 | Team lead | Daily and weekly |
| 11 | CSAT | Top-box responses ÷ all valid responses × 100, with the response rate | Head of support | Monthly |
| 12 | NPS | % promoters (9 to 10) − % detractors (0 to 6) | Head of support, with CX and product | Quarterly |
| 13 | Customer effort score (CES) | Sum of valid responses ÷ count of valid responses, on one declared scale | Team lead | Monthly |
| 14 | QA score | Mean weighted scorecard score of sampled conversations, 0 on any auto-fail | Agent (own score), team lead | Weekly calibration, monthly report |
| 15 | Cost per ticket | Total support cost ÷ tickets | Finance | Monthly |
| 16 | Cost per verified resolution | Total support cost ÷ verified resolutions | Finance and head of support | Monthly |
| 17 | Occupancy | Handle time ÷ (handle time + available idle time) × 100 | Team lead or workforce planner | Per interval, reviewed weekly |
| 18 | Agent attrition | Leavers in the period ÷ average headcount × 100, annualized | Head of support, with HR | Monthly, annualized each quarter |
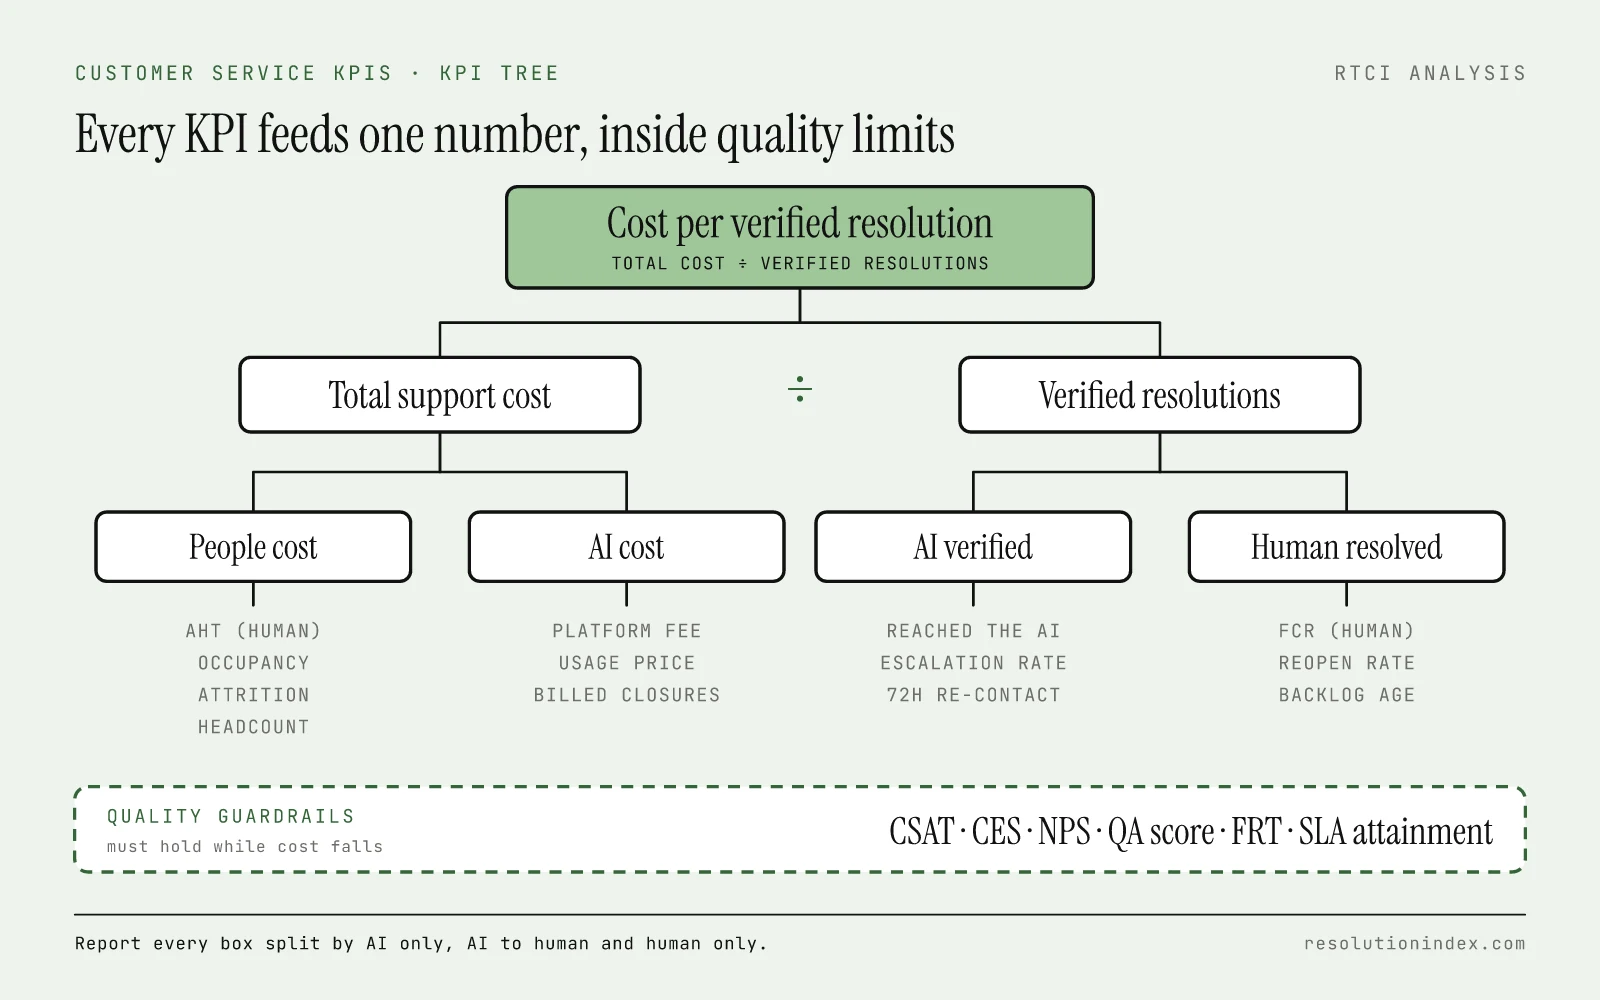
Start the review from row 16 and work down. If cost per verified resolution falls while CSAT, CES, QA and re-contact hold, the change is real. If it falls and any of those slip, the saving came from closing tickets that were not solved.
The worked example used in this guide
Worked example, hypothetical. All counts and costs below are assumptions chosen to show the math, not data from any company. Before AI, a team handled 10,000 conversations a month entirely with people: 9:00 AHT, 72% FCR and a fully loaded team cost of $80,000 a month. After launching an AI agent, the same month looks like this:
| Item | Count | How it is derived |
|---|---|---|
| Conversations | 10,000 | Same volume as before AI |
| Routed straight to people | 3,000 | Routing rules (billing disputes, VIPs, voice) |
| Reached the AI first | 7,000 | 10,000 − 3,000 |
| AI handed to a person | 2,100 | 30% of 7,000 |
| AI closed with no handoff | 4,900 | 7,000 − 2,100 |
| Of those, came back about the same issue within 72 hours | 490 | 10% of 4,900 |
| Verified AI resolutions | 4,410 | 4,900 − 490 |
| Contacts handled by people | 5,590 | 3,000 + 2,100 + 490 |
| Human team cost | $60,000 a month | Smaller team after leavers were not replaced |
| AI cost | $6,400 a month | $1 × 4,900 AI closures + $1,500 platform fee |
The same RTCI definition of a verified resolution applies throughout: no human handoff for an AI resolution, and no same-issue re-contact within 72 hours for anyone. How to measure AI resolution rate explains how to build it from a ticket export.
1. First response time (FRT)
Formula. FRT = first reply time − ticket created time, reported as the median and the 90th percentile for each first responder: the AI, a person on a direct ticket, and a person after a handoff (measured from the handoff, not from creation).
What it tells you. How long a customer waits to hear anything. It is mostly a staffing and routing signal.
How AI distorts it. An AI agent replies in seconds, so once it answers more than half of all conversations, the blended median FRT is the AI's number whatever happens in the human queue. In the example, 7,000 of 10,000 conversations get an AI reply, so the blended median cannot show human wait at all. The number that matters after launch is time from handoff to first human reply, because that customer has already waited once.
Owner. Team lead.
Target. From your baseline, per channel. Publish the median and the 90th percentile, since a mean hides the long tail.
2. Average resolution time (ART)
Formula. Resolution time = final resolved time − created time. Report the median and 90th percentile per cohort. For reopened tickets, use the last resolution, not the first.
What it tells you. How long the customer's problem lasted, including queue time, back-and-forth and any reopen.
How AI distorts it. AI closures take minutes, so blended resolution time drops sharply at launch even if nothing improved for people. AI-to-human conversations often get worse: the customer queues for the AI, then queues again for a person. Auto-closing silent conversations also shortens resolution time without solving anything. Count a closure followed by a same-issue contact within 72 hours as unresolved until the later contact closes.
Owner. Team lead.
Go deeper. First-contact vs end-to-end resolution covers how to measure the full journey across contacts.
3. Average handle time (AHT)
Formula. AHT = (talk or chat time + hold time + after-contact work) ÷ handled contacts. Weight by contacts when you combine days or agents; never average daily AHT figures.
What it tells you. Agent minutes per contact, which drives staffing and people cost.
How AI distorts it. AI removes the short contacts, so human AHT rises even when people work no slower. Worked example: before AI, 10,000 contacts × 9 minutes = 90,000 handle minutes. After AI, people handle 3,000 direct contacts at 11 minutes, 2,100 handoffs at 14 minutes and 490 re-contacts at 9 minutes: (33,000 + 29,400 + 4,410) ÷ 5,590 = 66,810 ÷ 5,590 = 11.95 minutes, or 11:57. Human AHT is up 33% while total human minutes are down 26%. A dashboard that flags the higher AHT as a performance problem is reading a change in the work.
Owner. Team lead. Use it for staffing, not as an individual agent target; rushing raises re-contact.
Benchmark. SQM Group reported an AHT of 424 seconds (talk plus wrap-up, no hold) in its 2021 study of call centers (published May 14, 2021). It is a human, voice, pre-AI number with a different formula from the one above, so use it to sanity-check, not as a target.
Go deeper. Average handle time after AI automation and the AHT calculator, which has an AI vs human split mode.
4. First contact resolution (FCR)
Formula. FCR = issues resolved on the first contact ÷ all issues × 100. Measure resolved either as no same-issue repeat contact within a fixed window or by a customer survey, and keep the method fixed.
What it tells you. Whether customers get a fix without coming back. It moves cost, CSAT and effort at once.
How AI distorts it. The blended number depends on how you count a handoff. Worked example: verified AI resolutions are 4,410; people resolve 2,250 of 3,000 direct tickets first time (75%) and 1,470 of 2,100 handoffs on the first human contact (70%).
| View | Math | FCR |
|---|---|---|
| Strict blend (a handoff is not first contact) | (4,410 + 2,250) ÷ 10,000 | 66.6% |
| Customer view (a resolved handoff counts) | (4,410 + 2,250 + 1,470) ÷ 10,000 | 81.3% |
| AI first-touch, verified | 4,410 ÷ 7,000 | 63.0% |
| Human, direct tickets | 2,250 ÷ 3,000 | 75.0% |
| Before AI, all human | Given | 72.0% |
Against the 72% baseline, the strict blend says FCR fell 5.4 points and the customer view says it rose 9.3. Both are arithmetically right. Report the AI and human rows and say which blend you use.
Owner. Team lead for human FCR; the AI owner for the AI row.
Benchmark. SQM Group (May 11, 2022) puts the industry average at 71%, calls 70% to 79% good and 80% or higher world-class, and says only 5% of call centers reach 80%. SQM measures FCR by customer survey within one business day of the call, in staffed call centers, so it does not describe an AI agent's rate.
Go deeper. FCR calculator (split mode) and first-contact vs end-to-end resolution.
5. Verified AI resolution rate
Formula. Verified AI resolution rate = (AI-closed conversations − those followed by a same-issue contact within 72 hours) ÷ conversations that reached the AI × 100.
What it tells you. The share of AI conversations that were actually solved and stayed solved. It is the AI's version of FCR and the denominator of cost per verified resolution.
How AI distorts it. This KPI exists to correct the distortion. Vendor dashboards usually count closures, and closures include customers who gave up or came back on another channel. Worked example: the AI closed 4,900 of 7,000 (70%), but 490 came back within 72 hours, so the verified rate is 4,410 ÷ 7,000 = 63%. Across RTCI's index of 20 platforms, the median vendor claim is 74% and the median realistic rate is 58.3%, a median gap of 17 points (RTCI index, Nov 2026).
Owner. Head of support, with the AI owner running the weekly numbers.
Target. From your own pilot. What is a good AI resolution rate explains how to read it against the index.
Go deeper. How to measure AI resolution rate and the 72-hour verified resolution SLA clauses.
6. Containment and deflection (and why neither is resolution)
Formula. Containment = AI conversations that ended without reaching a person ÷ AI conversations × 100. Deflection = self-service sessions that did not become a ticket within the window ÷ total inbound attempts × 100.
What it tells you. How much volume never reached a person. That is a workload number, useful for staffing.
How AI distorts it. Both count what did not happen, so an AI that refuses to escalate, or a widget that makes contacting a person hard, scores well. In the example, containment is 4,900 ÷ 7,000 = 70% while verified resolution is 63%; the 7-point gap is the 490 customers who came back. Deflection's denominator varies by vendor, as resolution rate vs deflection rate shows.
Owner. Head of support, as a diagnostic next to verified resolution rate, never as a target on its own.
7. Escalation rate
Formula. Escalation rate = AI-to-human handoffs ÷ conversations that reached the AI × 100. Example: 2,100 ÷ 7,000 = 30%.
What it tells you. How much of the AI's intake still needs a person, and, broken down by reason, where the knowledge base or routing has gaps.
How AI distorts it. Lower is not automatically better. An AI tuned to hold on to conversations lowers escalation and raises re-contact and complaints. Read it with the 72-hour re-contact rate: if escalation falls while re-contact rises, customers are being stuck, not helped. Also track handoff quality: time from handoff to first human reply, and whether the person had to ask the customer to repeat themselves.
Owner. The AI owner or the team lead for the AI queue.
Go deeper. Reduce AI-to-human escalations without adding headcount has a root-cause tagging template.
8. Reopen and 72-hour re-contact rate
Formula. 72-hour re-contact rate = resolved issues followed by a same-issue contact within 72 hours ÷ resolved issues × 100. Reopen rate is the narrower version: tickets reopened ÷ tickets solved × 100. Re-contact catches customers who open a new ticket or switch channels; reopen does not.
What it tells you. Whether fixes held. It is the cheapest quality signal you have, because it needs no survey.
How AI distorts it. AI closures fail quietly: the customer does not reopen the chat, they phone or email instead. A reopen rate taken from the AI's own conversation log misses that. Match on customer ID across channels. Example: 490 of 4,900 AI closures came back, a 10% re-contact rate.
Owner. Agents for their own tickets, team lead for the queue, AI owner for AI closures.
Target. From your baseline; choose the window (72 hours in this guide) once and keep it.
9. Backlog age
Formula. Backlog age = share of open tickets older than your threshold (open tickets older than X hours ÷ open tickets × 100), reported with the median age of open tickets. Example: 180 of 1,200 open tickets older than 48 hours is 15%.
What it tells you. Whether the team is keeping up, and where customers are waiting longest. Age shows trouble earlier than ticket count.
How AI distorts it. AI clears simple tickets fast, so the open count drops while the tickets left are harder and older. A falling backlog count with a rising median age means the team is falling behind on the complex work.
Owner. Team lead, daily.
10. SLA attainment
Formula. SLA attainment = tickets that met the target ÷ tickets under that SLA × 100, per SLA (first response, next response, resolution).
What it tells you. Whether you kept the promise you made to customers or in a contract.
How AI distorts it. If your helpdesk counts the AI's first message as the first reply, first-response SLA measures the bot. Worked example with a 4-hour first-response target: all 7,000 AI conversations get an AI reply in time, and 2,600 of 3,000 direct tickets get a human reply in time, so blended attainment is (7,000 + 2,600) ÷ 10,000 = 96%. Measured on human replies only, with 1,800 of 2,100 handoffs answered within 4 hours of the handoff, it is (1,800 + 2,600) ÷ 5,100 = 86.3%. Report the second number for the human queue.
Owner. Team lead.
Go deeper. The Erlang C calculator gives the agents needed to hit a phone service-level target at your post-AI handle time.
11. Customer satisfaction score (CSAT)
Formula. CSAT = top-box responses (4 and 5 on a 1 to 5 scale) ÷ all valid responses × 100. Report the response rate next to it.
What it tells you. How customers rated a specific interaction, right after it.
How AI distorts it. Response bias. The AI and human cohorts answer at different rates and for different reasons, and customers who quietly gave up on the AI often do not answer at all. Worked example: AI-resolved conversations return 300 responses from 4,900 (6.1%), 240 satisfied, so 80%. Human-handled conversations return 600 from 5,100 (11.8%), 510 satisfied, so 85%. Blended CSAT is 750 ÷ 900 = 83.3%. The 5-point gap sits inside a 95% margin of ±5.4 points at these sample sizes (1.96 × √(0.80 × 0.20 ÷ 300 + 0.85 × 0.15 ÷ 600)), so it is not yet a real difference. Survey every cohort with the same question and trigger, including re-contacted AI conversations.
Owner. Head of support.
Target. From your own trend at the same scale and top-box rule.
Go deeper. CSAT calculator (with margin of error), CSAT vs NPS vs CES and customer service survey questions.
12. Net Promoter Score (NPS)
Formula. NPS = % promoters − % detractors, from the question how likely are you to recommend us to a friend or colleague on a 0 to 10 scale. Promoters answer 9 or 10, passives 7 or 8 and detractors 0 to 6, per the Net Promoter System page. Example: 55% promoters and 20% detractors give an NPS of 35.
What it tells you. Overall loyalty to the company, which support influences but does not own.
How AI distorts it. Ticket-level NPS samples are small and noisy, and an AI rollout usually coincides with product and pricing changes. At 200 responses per group, the margin on an AI vs human NPS gap is about ±15.5 points, as CSAT vs NPS works out, so do not credit or blame the AI from a few points of movement.
Owner. Head of support, shared with CX and product.
Go deeper. NPS calculator and NPS survey questions.
13. Customer effort score (CES)
Formula. CES = sum of valid response values ÷ count of valid responses, on one declared scale; RTCI suggests 1 to 7, where 7 means strongly agree with the company made it easy for me to handle my issue. Example: 400 responses summing to 2,280 give a CES of 5.7.
What it tells you. How hard the customer had to work, which CSAT can miss when the final answer was right.
How AI distorts it. The effort in an AI journey is in the loops: rephrasing the question, being asked again for an order number, repeating everything to a person after the handoff. Asking CES only on AI-resolved conversations skips the customers who had to do that. Send it after the ticket reaches a final state, and split it by AI only, AI to human and re-contacted cohorts.
Owner. Team lead.
Go deeper. Customer effort score for AI support.
14. Quality assurance (QA) score
Formula. QA score = mean of the weighted scorecard scores of a random sample of conversations, where each conversation scores the sum of the weights of the criteria it passed, and 0 if any auto-fail occurs.
What it tells you. Whether answers were correct, actions were in policy and resolutions were real, judged by a person reading the conversation.
How AI distorts it. An AI agent is consistently polite, so tone and communication criteria flatter it while the failures that matter are factual: marking a conversation resolved when it was not, or stating a policy that does not exist. Score AI and human conversations on the same scorecard, pull a separate random sample of AI-resolved conversations, and let auto-fails override the weighted score. For a pass rate you report, about 200 conversations per group per month gives a worst-case 95% margin of ±6.9 points.
Owner. Agents see their own scores for coaching; the team lead or QA lead owns calibration and the queue score.
Go deeper. Customer service quality assurance has the nine-criterion scorecard and five auto-fails.
15. Cost per ticket
Formula. Cost per ticket = total support cost in the period (people fully loaded, tooling including AI, overhead) ÷ tickets in the period.
What it tells you. Average cost of handling demand. Finance's budgeting number.
How AI distorts it. It falls when AI arrives even if each human contact gets more expensive, because the denominator includes every conversation the AI touched. Worked example: before AI, $80,000 ÷ 10,000 = $8.00 per ticket. After, ($60,000 + $6,400) ÷ 10,000 = $6.64. But people now handle 5,590 harder contacts, so human cost per human contact is $60,000 ÷ 5,590 = $10.73, up from $8.00. Report both.
Owner. Finance.
Go deeper. Cost per ticket calculator.
16. Cost per verified resolution
Formula. Cost per verified resolution = total support cost ÷ verified resolutions, where a verified resolution was solved and had no same-issue re-contact within 72 hours. Compute it for the AI alone (AI cost ÷ verified AI resolutions) and for the whole operation.
What it tells you. What a real fix costs. It is the one number that falls only when cost drops or resolutions hold, so it is the top of the KPI tree.
How AI distorts it. Divided by dashboard closures, AI looks cheaper than it is. Worked example: AI cost $6,400 ÷ 4,900 closures = $1.31, but ÷ 4,410 verified resolutions = $1.45. For the whole operation, assume 4,590 of the 5,100 issues people owned ended resolved with no 72-hour re-contact: (4,410 + 4,590) = 9,000 verified resolutions, and $66,400 ÷ 9,000 = $7.38, against $80,000 ÷ 9,000 = $8.89 before AI if 90% of issues held then. For reference, the median AI cost per resolution across RTCI's index is $1.12 (RTCI index, Nov 2026).
Owner. Finance and head of support jointly.
Go deeper. Cost per verified resolution framework, the cost per verified resolution calculator and the Google Sheets tracker.
17. Occupancy
Formula. Occupancy = handle time ÷ (handle time + time available and waiting for a contact) × 100. Example: 312 handle minutes and 78 idle minutes give 312 ÷ 390 = 80%.
What it tells you. How busy agents are while available. Too low wastes payroll; too high burns people out and slows answers.
How AI distorts it. The AI removes contacts but the schedule stays, so occupancy drops until someone re-plans. In the occupancy calculator's example, 100 calls per 30 minutes at 3 minutes each run 14 agents at 71.4%; with 30% contained by AI and no re-plan, the same 14 agents run at 50%. Re-solve staffing with the post-AI volume and the higher human AHT, not the old AHT.
Owner. Team lead or workforce planner.
Target. From your baseline and service-level goal. Re-plan with the Erlang C or support staffing calculator.
18. Agent attrition
Formula. Attrition = agents who left in the period ÷ average headcount in the period × 100. Annualize a quarterly figure by multiplying by 4. Example: 2 leavers on an average of 25 agents in a quarter is 8%, or 32% annualized. Report voluntary leavers separately from planned reductions.
What it tells you. Whether the team is stable enough to keep its knowledge, and what hiring and ramp cost you are carrying.
How AI distorts it. Two ways. Roles removed after an AI launch are not attrition and should not sit in the same number. And people who stay now handle a queue made of the hardest and angriest contacts, which this guide's example shows as 11:57 AHT instead of 9:00. Watch voluntary attrition and QA trends together in the two quarters after launch.
Owner. Head of support, with HR.
Benchmark. SQM Group reported annual agent turnover of 28% in its 2021 call center study, of which 62% left the organization and 38% moved elsewhere inside it. It predates AI agents and covers call centers only.
Which KPIs should each role own?
A KPI nobody can change in their own work becomes a number people explain rather than act on. Split them by what each role controls.
| Role | KPIs to own | Review | Use with care |
|---|---|---|---|
| Agent | QA score, re-contact rate on own tickets, CES and CSAT on own tickets as coaching material | Weekly 1:1 | AHT as a personal target, which pushes rushed closures |
| Team lead | FRT and SLA attainment by queue, backlog age, human FCR, escalation rate and handoff pickup time, 72-hour re-contact, AHT on human contacts, occupancy, CES, QA calibration | Daily stand-up, weekly review | Blended FRT and blended AHT |
| Head of support | Verified AI resolution rate, cost per verified resolution, CSAT per cohort with response rate, NPS, SLA attainment, agent attrition | Monthly, quarterly for NPS and attrition | Containment, raw deflection |
| Finance | Cost per ticket, cost per verified resolution, AI spend against contract terms | Monthly | Vendor-reported resolution counts used as the billing denominator |
For a team lead, the shortest useful daily view is four numbers per queue: oldest open ticket, share past the SLA threshold, time from handoff to first human reply, and yesterday's re-contacts. Everything else can wait for the weekly review.
Which vanity metrics should you drop?
RTCI's view: these numbers look like progress on a slide and say little about whether customers were helped. Keep them in the raw data, take them off the scorecard as targets.
- Containment on its own. It rises when the AI refuses to hand off. Report it only next to verified resolution and re-contact.
- Raw deflection. Its denominator is set by the vendor or the widget, and a customer who could not find a way to reach a person counts as deflected.
- Share of conversations handled by AI. Handled means touched. Klarna's filings report this kind of figure, and the Klarna case study shows what it leaves out.
- Blended AHT as a target. It falls because AI contacts are short, and human AHT rises for the same reason. Neither move tells you about performance.
- Tickets closed per agent. It rewards closing, not solving, and drops when AI takes the easy tickets.
What would prove this wrong: if, in your own data, containment and verified resolution rate move together month after month, within a point or two, then containment is a cheap early proxy and worth watching daily. Check that with three months of data before relying on it.
Where do benchmarks for these KPIs come from?
Only three in this guide have a published benchmark with a stated method that RTCI could open: SQM Group's FCR bands (survey-based, May 2022), its 424-second AHT and its 28% annual agent turnover (both from its 2021 study). All three describe human-staffed call centers before AI agents. No published source RTCI found gives a method-matched benchmark for the AI and human splits used here.
For every other KPI, set the target from your own baseline: take three months under the written definition, note the median and the spread, and set the target as a move on that baseline while the quality KPIs hold. When an AI agent launches, restart the baseline for any KPI the AI changes the mix of, which in practice is rows 1 to 4, 10, 11, 15 and 17. The fair AI support pilot scorecard shows how to set those thresholds before a pilot starts.
How RTCI calculates these numbers
- Realistic resolution rate. Each vendor’s published claim is discounted by one fixed rule for every vendor, with an extra discount when the figure measures deflection rather than resolution.
- Cost per resolution. Per-session and per-conversation prices are divided by that realistic rate, because failed attempts are billed too. Mandatory platform fees are spread over 2,000 to 4,000 resolutions a month.
- Prices. Every price links to the vendor’s own page as of the date shown. Costs marked ~ or est. are RTCI estimates for vendors that publish no per-unit price.
Frequently asked questions
What are the most important customer service KPIs?
For a team running an AI agent next to people, start with five: verified AI resolution rate, 72-hour re-contact rate, first contact resolution split by AI and human, CSAT per cohort with its response rate, and cost per verified resolution. Together they show whether issues were solved, whether the fixes held, how customers felt and what each real resolution cost. The other 13 in this guide explain why those five moved.
What are examples of customer service KPIs?
Common examples are first response time, resolution time, average handle time (AHT), first contact resolution (FCR), escalation rate, re-contact rate, backlog age, SLA attainment, CSAT, NPS, customer effort score (CES), QA score, cost per ticket, cost per verified resolution, occupancy and agent attrition. Teams with an AI agent add verified AI resolution rate and track containment and deflection only as diagnostics.
What KPIs should a customer service team leader track?
The queue-level ones a team lead can change within a week: first response time and SLA attainment by queue, backlog age, human FCR, 72-hour re-contact rate, escalation rate and how fast handoffs are picked up, AHT on human contacts, occupancy, CES, and QA scores with calibration. Cost and attrition belong to the head of support, with the team lead feeding them.
How do you measure customer service KPIs when AI handles part of the queue?
Tag every conversation with who touched it first and whether it was handed off, then report each KPI for three cohorts: AI only, AI to human, and human only. Keep a blended number only where the total matters, such as total cost. Use one resolution definition for both halves; RTCI uses no human handoff for AI resolutions and no same-issue re-contact within 72 hours for everyone.
Why did average handle time go up after adding AI?
Because the AI took the short, repetitive contacts and left people the long ones. In this guide's worked example, human AHT rises from 9:00 to 11:57 (+33%) while total human handle minutes fall 26%, from 90,000 to 66,810. Judge the human team on minutes per verified resolution and quality, not on the higher AHT.
What are good benchmarks for customer service KPIs?
Very few are published with a method you can match. SQM Group reports an average FCR of 71% from customer surveys and rates 80% or higher as world-class (May 2022), and reports AHT of 424 seconds (talk plus wrap-up) and 28% annual agent turnover from its 2021 study. All three describe human-staffed call centers. For everything else, set targets from your own baseline under a written definition.
What is the difference between customer service KPIs and metrics?
A metric is anything you can count, such as tickets created or minutes on hold. A KPI is a metric with a target, an owner and a review date, chosen because a change in it should change a decision. Most teams measure dozens of metrics and should run on 10 to 18 KPIs.
Change log
- Published.
Read next
Keep reading
Picked for this article: the pieces it cites and the ones that answer the next question buyers usually ask.
Most related
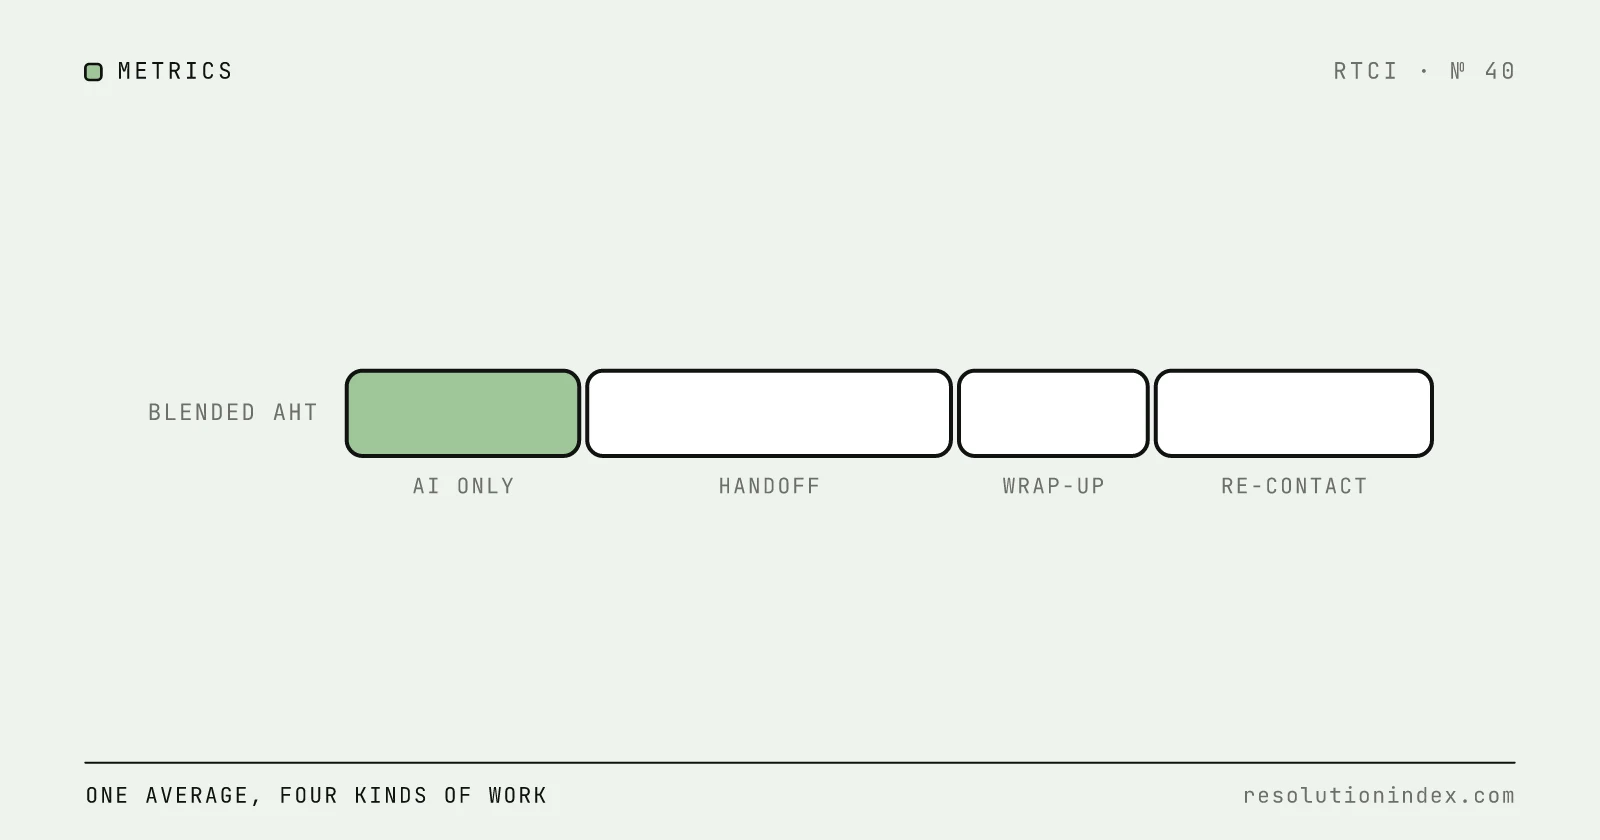
Average Handle Time After AI Automation: Formula and Benchmark Model
Calculate blended AHT without hiding AI work, human handoff, after-contact work, or same-issue re-contact. Includes a reproducible cohort model and scenario worksheet.
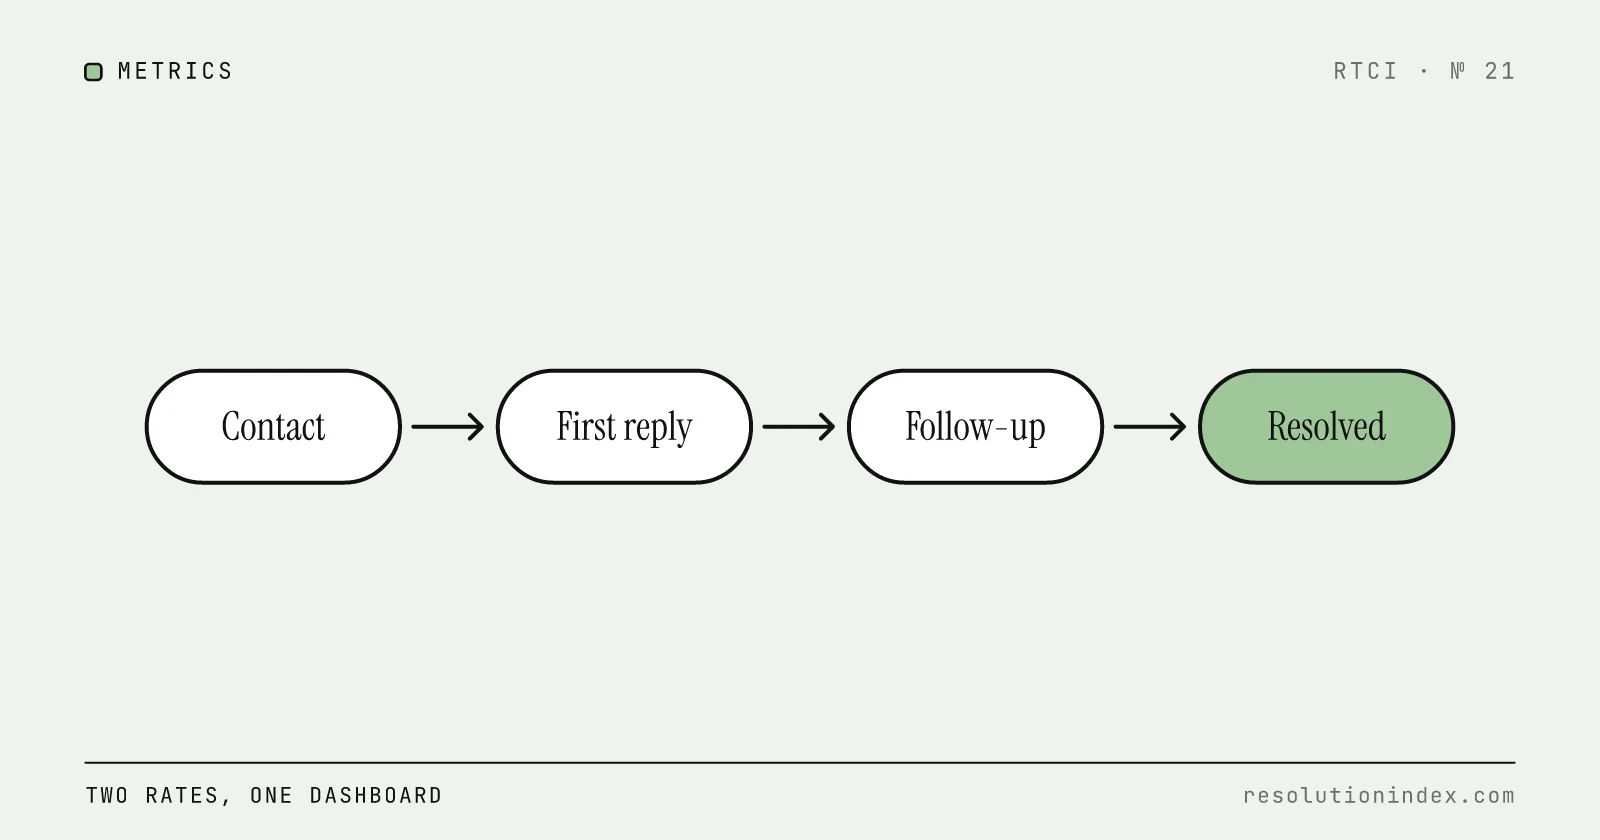
First-Contact vs End-to-End Resolution
A metric decision guide for AI support teams: when to use first-contact resolution rate vs end-to-end resolution rate, how to track both, and how deflection fits into the same dashboard.
How to Measure AI Resolution Rate Internally
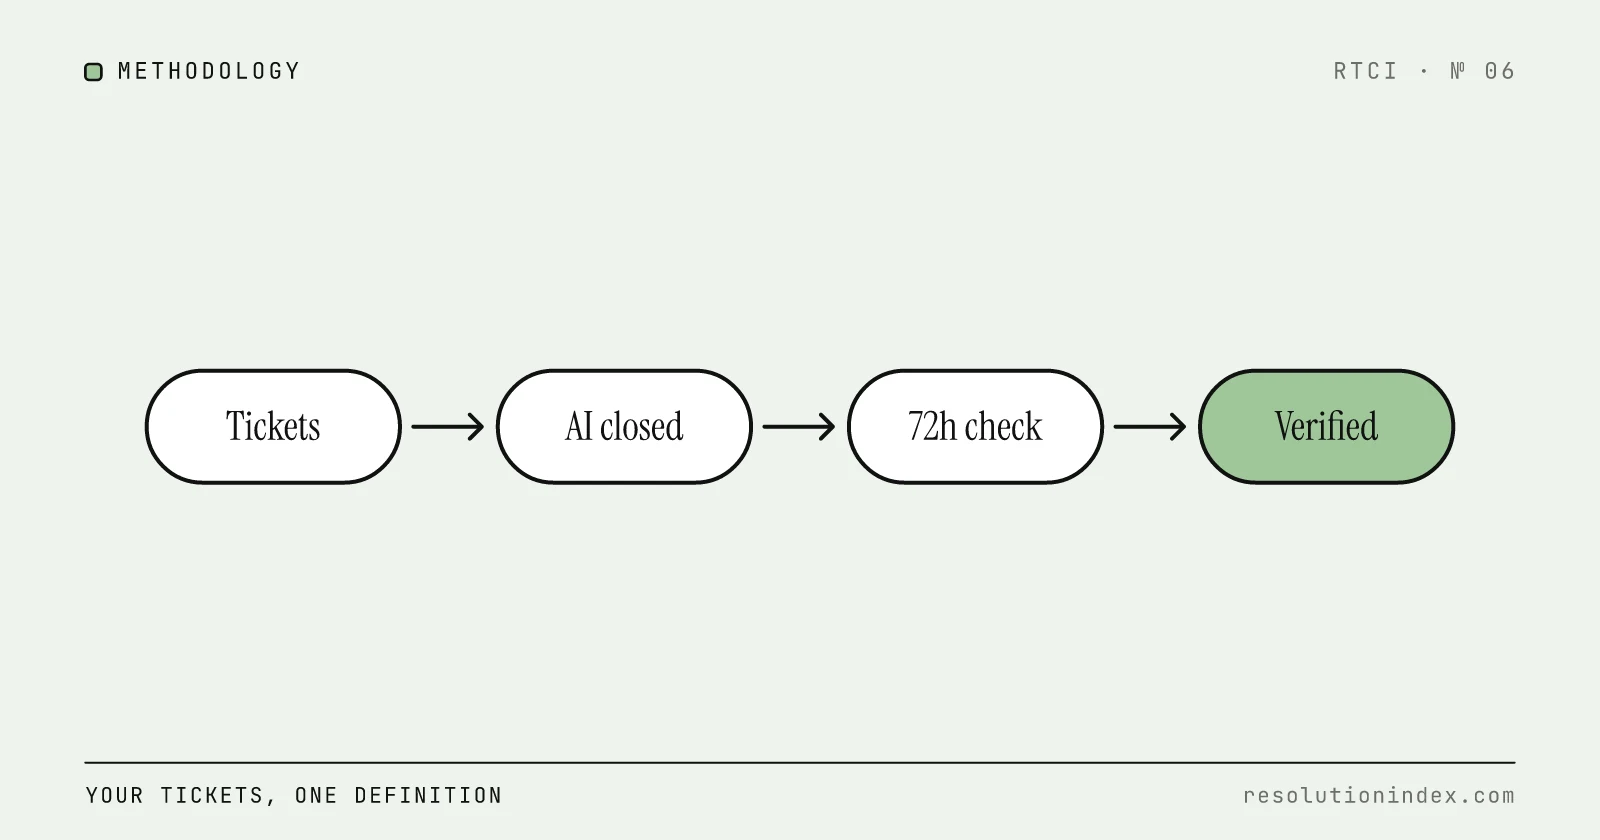
Vendor dashboards report resolution rates that no two vendors calculate the same way. This is a practical, vendor-agnostic methodology to measure your own AI resolution rate using your own ticket data, built on RTCI's 72-hour verified resolution standard.
Cost Per Verified Resolution: A New Framework
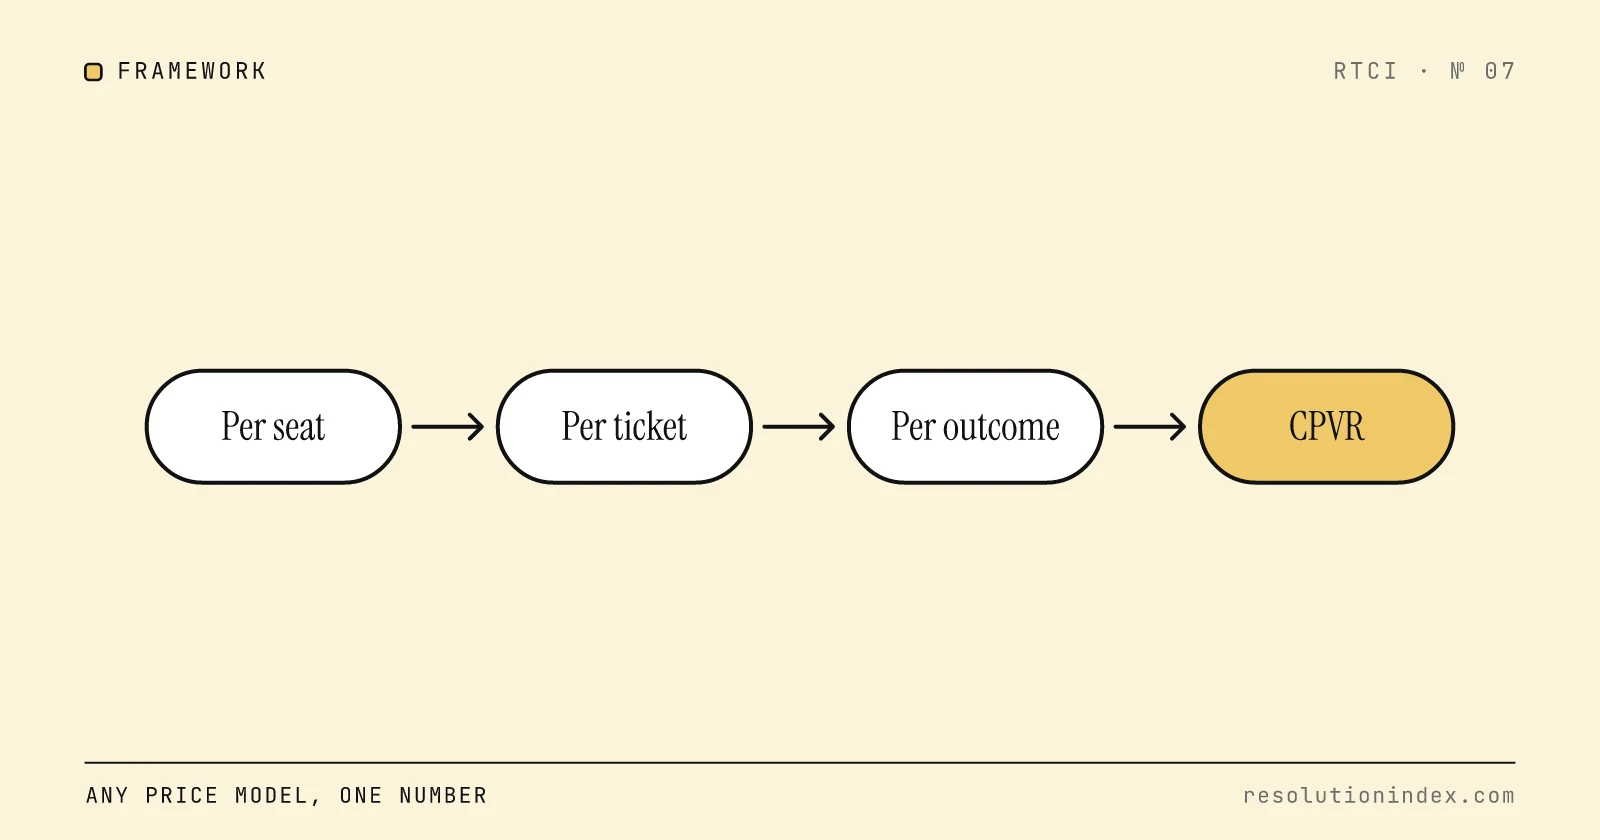
Per-seat, per-ticket, and per-resolution pricing models all produce different numbers for the same underlying cost. RTCI's three-layer cost model normalizes any vendor's pricing into a single comparable metric: cost per verified resolution.
Customer Service Quality Assurance: A QA Scorecard for Human and AI Conversations (2026)
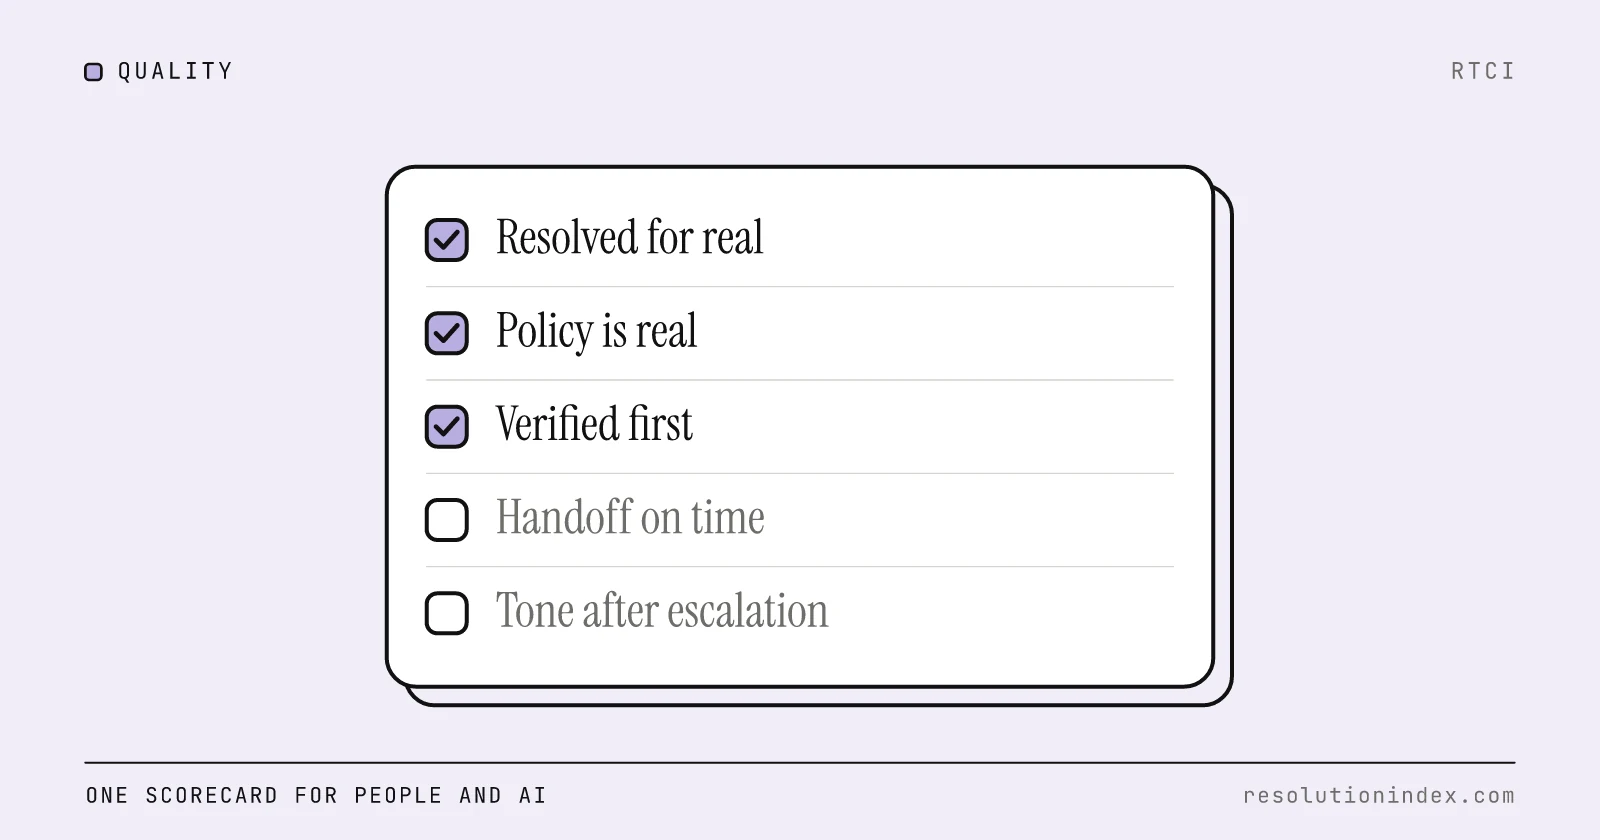
One QA program that grades human agents and the AI agent on the same scorecard: nine weighted criteria with pass/fail definitions, five auto-fail checks for false resolutions, invented policy, missed handoffs, unverified actions and tone after escalation, the sample-size math, calibration with an agreement-rate example, and a cadence by team size.