Published Aug 10, 2026 · Updated Nov 19, 2026 · 11 min read
How to Design a Fair AI Support Pilot Scorecard
A weighted scorecard with 8 dimensions, hard-stop gates, and copy-paste Week 1–4 templates for evaluating an AI support pilot honestly.
 Written by Andrew Hall, Editor
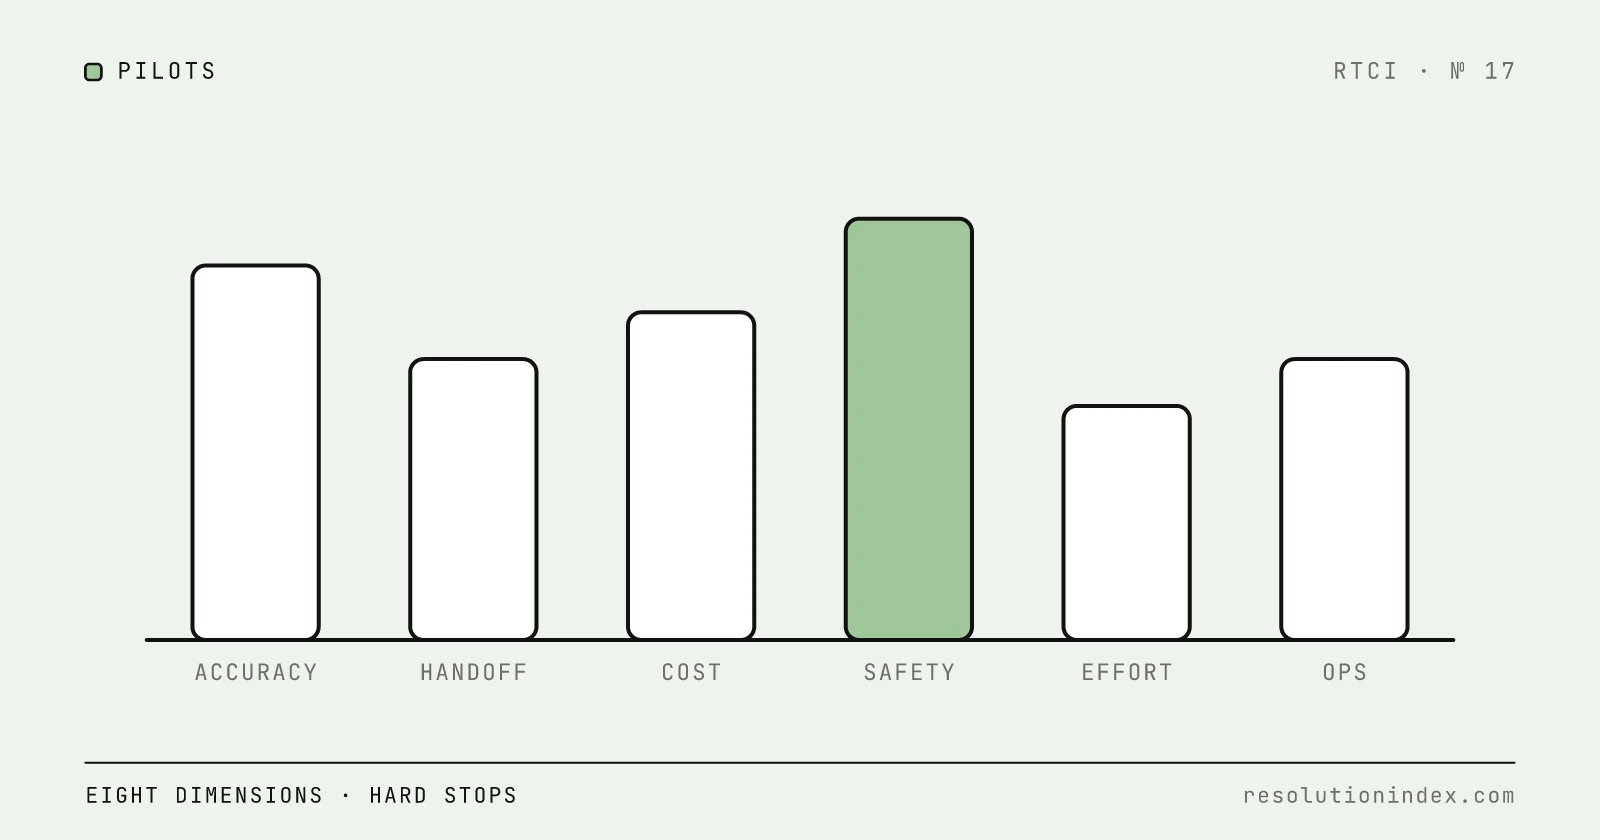
A fair AI support pilot scorecard is a weighted evaluation sheet that judges a vendor against outcomes your business actually cares about, with hard-stop gates that kill the deal if critical thresholds are missed. Build it before the pilot starts, share it with the vendor, and score weekly so sales pressure does not replace data at decision time.
The version below has eight weighted dimensions (verified resolution and CSAT carry 35 of 100 points), six pass/fail gates, a data collection plan, week 1–2 and week 3–4 templates, and a worked example. For the surrounding timeline and rollout cadence, use the AI Support Pilot 90-Day Playbook. To turn the cost numbers into a vendor comparison, use the Cost per Verified Resolution Calculator.
What Makes a Pilot Scorecard Fair
Fairness breaks down into three practical properties: relevance, transparency, and veto power.
Relevance. Every dimension must map to a business outcome. Resolution rate is only useful when paired with verification. A bot that marks tickets solved to inflate a metric is worse than no bot at all. That is why How to Measure AI Resolution Rate emphasizes verified resolution: the customer confirms the issue is fixed or does not reopen within a defined window.
Transparency. When the vendor knows the weights and gates in advance, they optimize for the right behavior. Hide the scorecard and the readout turns into a surprise, which favors the better storyteller over the better product.
Veto power. A 95% overall score is meaningless if the bot leaked customer data, gave dangerous instructions, or produced false answers in regulated categories. Hard-stop gates exist so the final average never buries a dealbreaker.
A fair scorecard also measures the agent experience. If agents spend more time correcting the AI than they used to spend solving tickets, the savings are not real. Measure their load, their edits and their sentiment, not only headcount.
The 8 Scoring Dimensions (with Weights)
The scorecard uses eight dimensions totaling 100 points. Each dimension is scored 0–10 by the pilot review committee, then multiplied by its weight.
| # | Dimension | Weight | What to measure |
|---|---|---|---|
| 1 | Verified resolution rate | 20 | % of AI-handled tickets where the customer confirms resolution or does not reopen within 7 days. Target: match or exceed human baseline for the same category. At 80% of baseline → 6/10; at 100%+ → 10/10. |
| 2 | Customer satisfaction impact | 15 | CSAT for AI-handled vs human-handled tickets, same period and category. Drop >3 pts = yellow flag; >5 pts = red flag, once each group has enough responses for that gap (see sample sizes). |
| 3 | Quality and safety | 15 | Sample 50 AI responses weekly. Classify as correct / acceptable with edit / wrong. Wrong/unacceptable must stay below 2% to score above 5/10. |
| 4 | Agent experience and workflow fit | 10 | Agent load change, time-to-first-response improvement, override/correction rate. If cleanup time exceeds old solve time, this dimension fails. |
| 5 | Implementation and integration speed | 10 | Timeline adherence, auth correctness, data sync latency, handoff quality. Fast launch + broken handoff = not a win. |
| 6 | Scalability and coverage | 10 | % of eligible categories and languages the AI handles without degrading quality. |
| 7 | Total cost and ROI truth | 10 | Actual cost per verified resolution vs human baseline and vendor projection. See Why Vendor-Claimed Resolution Rates Don't Match Reality. |
| 8 | Vendor collaboration and honesty | 10 | Responsiveness, root-cause transparency, willingness to admit limitations. |
Pass/Fail Gates (Hard Stops)
Hard-stop gates are binary. If any gate fails, the pilot stops or the vendor is disqualified, even if the weighted score looks acceptable.
| Gate | Rule | Fail condition |
|---|---|---|
| 1. Data and privacy compliance | No training on your data without contract terms; passes security review; meets GDPR/HIPAA if applicable; auditable access logs. | Automatic disqualification. |
| 2. Critical error rate | Any response that causes harm, leaks data, violates policy, or gives dangerous instructions. | More than one confirmed critical error during the pilot. |
| 3. CSAT floor | AI-handled CSAT vs human baseline. | >10 points below baseline for two consecutive weeks. |
| 4. Reopen or escalation flood | AI reopen rate vs human baseline. | Exceeds 150% of baseline for two consecutive weeks. |
| 5. Agent acceptance | Agent sentiment and attrition signal. | >30% of agents say the tool makes their job harder, or attrition spikes. |
| 6. Vendor transparency | Vendor shares raw logs, confidence scores, and model-level root causes. | Stonewalling more than once after formal request. |
Data Collection Plan
A scorecard is only as good as its inputs. Define the owner, source, cadence, and exact definition of every metric.
Metric ownership
- Verified resolution rate → support operations
- CSAT → customer experience
- Quality and safety → support + product + compliance reviewer
- Vendor collaboration → pilot program manager
Data sources
- Resolution/reopen data → your help desk
- CSAT → post-resolution survey, with identical wording for AI and human tickets (customer service survey questions)
- Agent feedback → short weekly pulse survey
- Cost data → finance / procurement
- Security evidence → vendor audit package + your access logs
Definitions
- Verified resolution: customer did not reopen within 7 days and no agent corrected the outcome.
- Reopen: any customer reply that reopens a closed/solved ticket.
- Escalation: AI hands off to a human before a first answer is sent.
- Critical error: response causes harm, violates policy, or exposes data.
Sample sizes
- Quality/safety: inspect ≥50 AI-handled tickets/week or 5% of volume, whichever is larger.
- CSAT comparison: size each group to the smallest gap you plan to act on, using the margin below.
An AI-vs-human CSAT gap is a difference of two proportions. At 95% confidence its margin is about 1.96 × √(p(1 − p) ÷ n₁ + p(1 − p) ÷ n₂), where p is CSAT as a decimal and n₁, n₂ are the responses in each group. At 80% CSAT with equal groups:
| Responses per group | Margin on the AI-vs-human gap |
|---|---|
| 30 | ±20.2 pts |
| 100 | ±11.1 pts |
| 250 | ±7.0 pts |
| 500 | ±5.0 pts |
| 1,000 | ±3.5 pts |
At 30 per group the sum is 1.96 × √(0.80 × 0.20 ÷ 30 × 2) = 1.96 × √0.01067 = ±20.2 points. So 30 responses only separate a gap of about 20 points from noise.
The flags above need far more. The 10-point CSAT floor needs about 123 responses per group in each week it is judged, the 5-point red flag about 492, and the 3-point yellow flag about 1,366. Higher CSAT narrows the margin, but not enough to rescue small samples: at 88%, 30 per group still gives about ±16.4 points.
Below those counts, report the gap as directional, pool weeks or merge similar categories, and lean on verified resolution and reopen rate for the decision. The margin also covers sampling error only. Survey responders choose to answer, and no formula corrects for that.
Cadence
- Collect daily operational metrics automatically.
- Review weekly with the vendor.
- Hold formal scoring sessions at the end of weeks 2 and 4.
- Do not wait until week 4 to look at data. Spotting trends early is the point of weekly scoring.
Week 1–2 Scorecard Template
Use this template during the first half of the pilot. Focus on implementation correctness, early safety signals, and baseline establishment.
| Dimension | Metric | Score 0–10 | Notes |
|---|---|---|---|
| Verified resolution rate | Baseline human: ___% AI: ___% | ||
| CSAT impact | Human: ___ AI: ___ Delta: ___ | ||
| Quality and safety | Sampled: ___ Wrong: ___% Critical errors: ___ | ||
| Agent experience | Load change: ___% Override rate: ___% Pulse: ___ | ||
| Implementation speed | Go-live: ___ Integration issues: ___ Handoff quality: ___ | ||
| Scalability and coverage | Categories live: / Languages live: / | ||
| Cost and ROI truth | CPVR: $___ Projected: $___ Human baseline: $___ | ||
| Vendor collaboration | Response time: ___ Root-cause transparency: ___ | ||
| Weighted total | ___ / 100 |
Hard-stop gates: Data compliance: ___ | Critical errors: ___ | CSAT floor: ___ | Reopen flood: ___ | Agent acceptance: ___ | Vendor transparency: ___
During weeks 1–2, treat unexpected negative signals seriously but do not overreact to noise. A bad first week with a clear action plan and fast recovery is different from a bad first week with excuses. Document both the numbers and the response.
Week 3–4 Scorecard Template
In weeks 3–4 the scorecard shifts from baseline to sustained performance. Use the same dimensions and weights, but raise the evidence bar.
| Dimension | Metric | Score 0–10 | Notes |
|---|---|---|---|
| Verified resolution rate | Rolling 14-day: ___% vs baseline: ___% Trend: ___ | ||
| CSAT impact | Rolling 14-day AI: ___ Human: ___ Delta trend: ___ | ||
| Quality and safety | Rolling sample: ___ Wrong: ___% Critical errors to date: ___ | ||
| Agent experience | Time recovered/agent/day: ___ min Edit rate: ___% Pulse: ___ | ||
| Implementation speed | Open blockers: ___ Backlog resolved: / | ||
| Scalability and coverage | Categories added: ___ Quality degradation: ___ | ||
| Cost and ROI truth | Verified resolution volume: ___ CPVR: $___ vs projection: $___ | ||
| Vendor collaboration | Issues escalated: ___ Vendor-owned fixes delivered: ___ | ||
| Weighted total | ___ / 100 |
Hard-stop gates: Data compliance: ___ | Critical errors: ___ | CSAT floor: ___ | Reopen flood: ___ | Agent acceptance: ___ | Vendor transparency: ___
At the end of week 4, hold a formal readout. Each dimension owner presents evidence, not impressions. The program manager records final score, gate status, and a clear recommendation: proceed, proceed with conditions, or stop.
Worked Example: Scoring a Hypothetical Pilot
Worked example: every figure below is an assumption chosen to show the scoring, not a result from a real pilot. Assume a 30-day pilot of an AI agent on billing and account-management tickets. Your human baseline is 72% verified resolution and CSAT 88. The vendor's proposal projected 65% AI resolution at a fully loaded $4.20 CPVR.
Week 2 Scores
| Dimension | Score | Weighted | Notes |
|---|---|---|---|
| Verified resolution rate (58% = 80% of baseline) | 6/10 | 12.0 | Below target, but recoverable |
| CSAT impact (85, −3 pts) | 7/10 | 10.5 | Within yellow-flag range |
| Quality and safety (3% wrong, 0 critical) | 5/10 | 7.5 | Wrong rate above 2% threshold |
| Agent experience (10% time saved, 25% override) | 6/10 | 6.0 | Override rate too high |
| Implementation and integration (on time, auth bug fixed D10) | 8/10 | 8.0 | Clean launch |
| Scalability and coverage (billing only, stable) | 6/10 | 6.0 | Narrow but controlled |
| Cost and ROI truth ($5.10 CPVR vs $4.20 projected) | 5/10 | 5.0 | Volume lower than projected |
| Vendor collaboration (daily standups, transparent logs) | 9/10 | 9.0 | Strong |
| Weighted total | 64.0 / 100 | Not a clear win, but recoverable |
All hard-stop gates pass: no critical errors, CSAT within floor, reopen under threshold, agents neutral-to-positive, vendor transparent.
Committee sets week 3 targets: reach 65% verified resolution, cut wrong answers to ≤2%, reduce override rate to ≤15%.
Week 4 Scores
| Dimension | Score | Weighted | Notes |
|---|---|---|---|
| Verified resolution rate (67%) | 8/10 | 16.0 | Trending up |
| CSAT impact (87, −1 pt) | 8/10 | 12.0 | Gap narrowed; directional at pilot volumes |
| Quality and safety (1.5% wrong, 0 critical) | 8/10 | 12.0 | Hitting threshold |
| Agent experience (20% time saved, 12% override, pulse up) | 8/10 | 8.0 | Healthy |
| Implementation and integration (stable) | 9/10 | 9.0 | No blockers |
| Scalability and coverage (expanded to account mgmt, small dip) | 7/10 | 7.0 | Acceptable |
| Cost and ROI truth ($4.40 CPVR as volume ramps) | 7/10 | 7.0 | Near projection |
| Vendor collaboration (strong) | 9/10 | 9.0 | Consistent |
| Weighted total | 80.0 / 100 | Clear conditional proceed |
All gates still pass. Recommendation: proceed with conditions. Expand to a 90-day rollout with monthly scorecard reviews, keep hard-stop gates active, and maintain human-in-the-loop for regulated categories.
Week 2 scored 64, just under the stop line, but the committee had a named root cause and targets for each weak dimension, which the decision rules below allow. Week 4 scored 80, the top of the conditional band, so expansion comes with conditions rather than a full rollout.
Common Scorecard Gaming Tactics (and How to Stop Them)
Vendors are paid to make the pilot look good. Close these loopholes in the pilot agreement before kickoff.
| Tactic | How it works | Prevention |
|---|---|---|
| Cherry-picked routing | Only easiest tickets routed to AI | Define eligible categories upfront; require real category volume, not curated subset |
| Auto-close / auto-solve | Ticket marked solved after one answer | Use 7-day verified resolution window; count any reopen as non-resolution |
| Redefined CSAT | Survey only AI-handled or too early | Same survey cadence/timing for AI and human; compare within category |
| Hiding bad answers | Aggregate dashboards, no raw logs | Make raw logs a hard-stop gate before kickoff |
| Shifting cost definitions | Cost per ticket touched, ignoring cleanup | Calculate fully loaded CPVR using the Cost per Verified Resolution Calculator |
| Blaming edge cases | Every failure is "edge case" | Track failure categories; if it is 20% of your volume, it is not an edge case |
From Pilot to Purchase Decision
The scorecard does not make the decision alone, but it provides the evidence structure the decision needs. At the end of the pilot, produce three outputs: a final score, a gate report, and a risk-adjusted business case.
Final score interpretation
- >80: strong candidate
- 65–80: conditional proceed
- <65: stop unless a specific, fixable root cause has a credible recovery plan
Gate report. List every hard-stop gate with pass/fail status and evidence. If any gate failed, the final score is irrelevant. Document precisely so future vendor conversations start from facts, not feelings.
Risk-adjusted business case. If pilot CPVR was 15% above projection, apply at least a 15% uplift to the vendor's full-scale estimate. Add buffer for category expansion, seasonal spikes, and ongoing quality monitoring. See Why Vendor-Claimed Resolution Rates Don't Match Reality.
Purchase conditions to consider
- 90-day post-purchase review clause using the same scorecard
- Human-in-the-loop policy for regulated/high-value/safety-critical categories
- Per-resolution pricing or cap tied to verified outcomes
- Right to reduce scope if quality gates fail after go-live
Archive the scorecard and decision rationale. In six months, when someone asks why the tool was approved or rejected, the answer should be one file away.
FAQ
Does this scorecard work for any vendor? Yes. The dimensions do not assume a vendor or pricing model. Adjust targets to your baseline, ticket mix, and industry.
What if my pilot is only two weeks long? Shorten to one scorecard per week, but keep dimensions and gates. Be stricter on hard-stop gates because recovery trends are harder to observe.
How do I measure verified resolution if my help desk doesn't track reopen windows cleanly? Use a proxy such as no customer reply for seven days after the AI's final answer, plus manual spot checks. See How to Measure AI Resolution Rate.
Should the vendor see the scorecard before the pilot starts? Yes. Share weights, gates and targets in the kickoff deck so the vendor optimizes for the same outcomes you will score.
What if the vendor disagrees with a score? The scorecard is owned by the buyer. Allow evidence submissions, but do not negotiate weights mid-pilot unless a clear measurement flaw is discovered and documented.
Do I need a separate security scorecard? Security gates belong in the hard-stop section, but a detailed security review should still be run by your security/compliance team. Do not substitute this operational scorecard for a full vendor risk assessment.
How do I compare two vendors with different pricing models? Normalize to cost per verified resolution. Use the Cost per Verified Resolution Calculator to account for per-ticket, per-resolution, seat, and platform-fee structures.
What happens if the scorecard says stop but leadership wants to proceed? Document the gap between evidence and intuition. If the decision overrides the scorecard, require specific conditions, accountability, and a re-review date in writing.
Should agent sentiment be a gate or a scored dimension? Both. Agent pulse score contributes to the agent experience dimension, and a sustained negative trend triggers the hard-stop gate.
Can I reuse the scorecard for post-launch monitoring? Yes, and you should. Convert the weekly pilot scorecard into a monthly health check to protect value after the contract is signed.
Change log
- Made the worked example a labeled hypothetical instead of a Fin projection, removed a takeaways list whose 45% weighting contradicted the scorecard, and cut em dashes and filler.
- Published.
Read next
Keep reading
Picked for this article: the pieces it cites and the ones that answer the next question buyers usually ask.
Most related
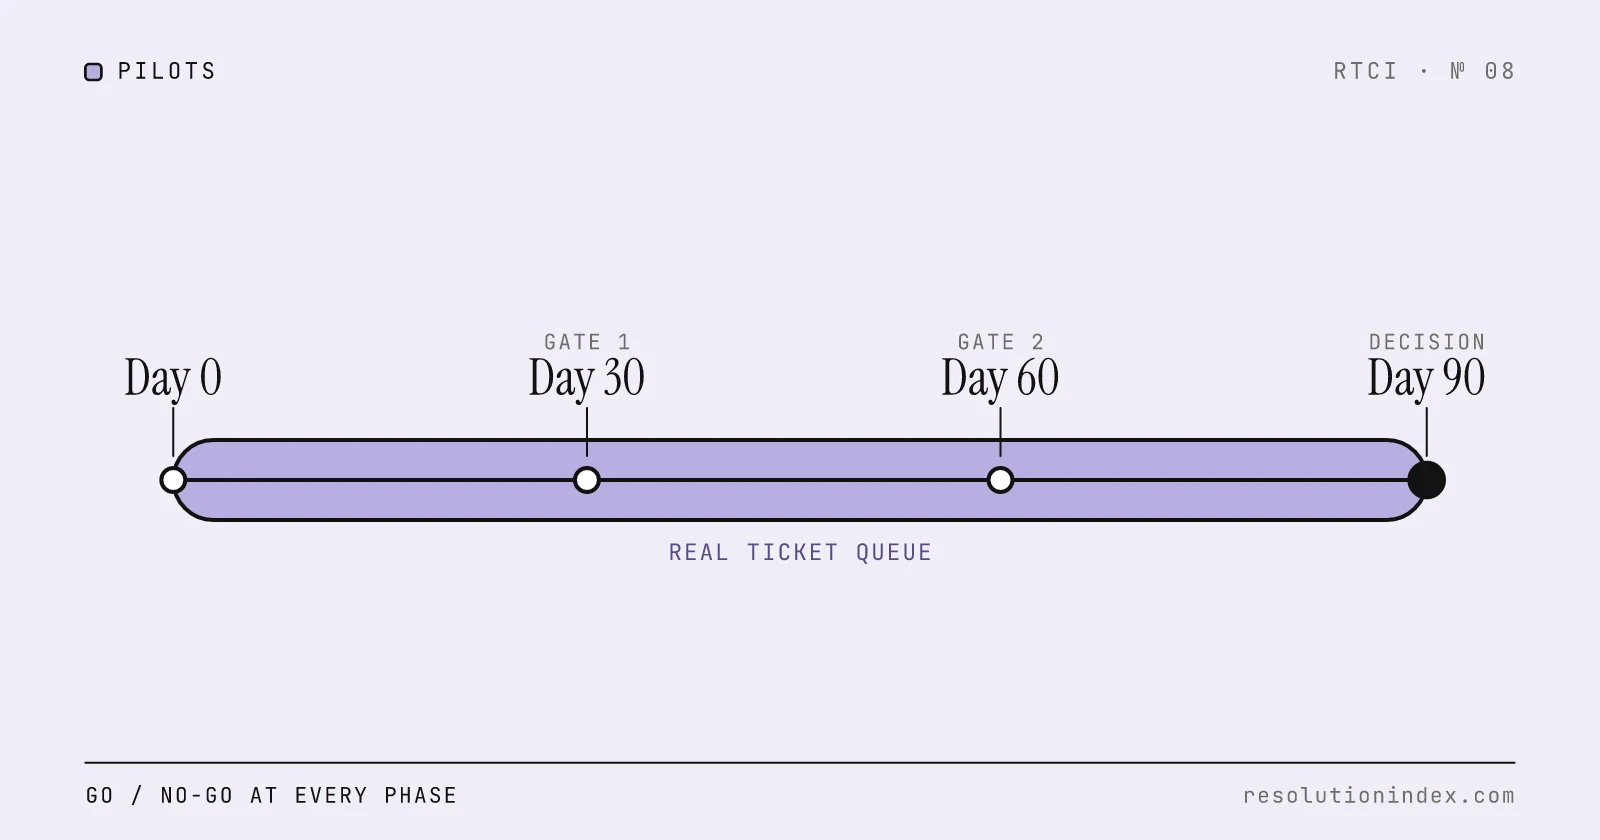
How to Pilot an AI Support Agent: A 90-Day Playbook
A vendor-agnostic 90-day plan for testing an AI support agent against your real ticket queue, with go/no-go criteria at each phase and clear rules for when to stop.
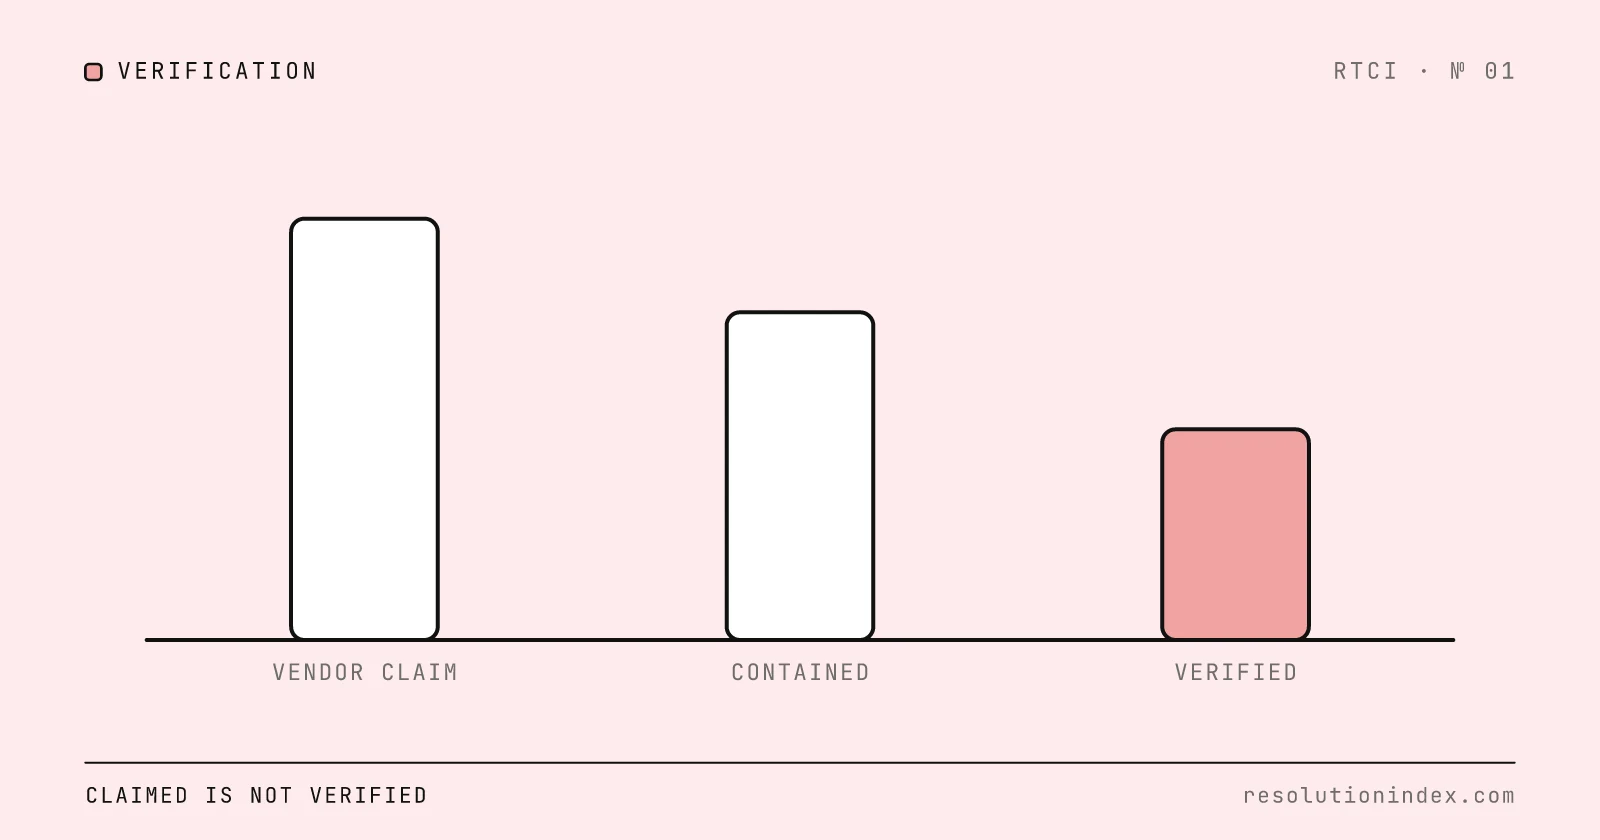
AI Resolution Rates: Why Vendor Claims Are Often Inflated
See how AI support vendors blur resolution, containment and deflection, how RTCI discounts each claim, and the five questions to ask before you compare two rates.
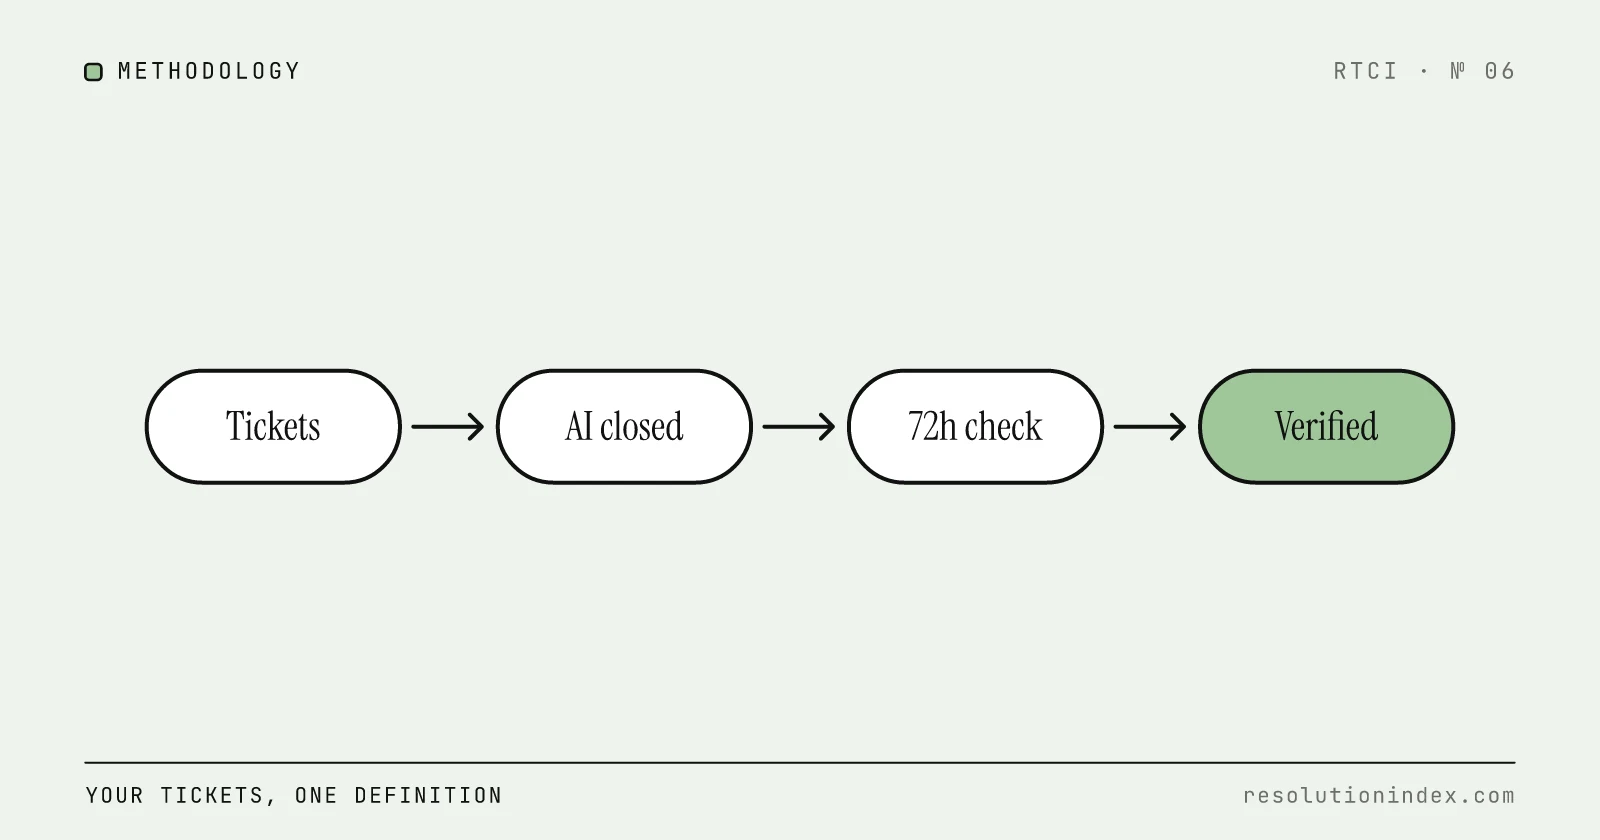
How to Measure AI Resolution Rate Internally
Vendor dashboards report resolution rates that no two vendors calculate the same way. This is a practical, vendor-agnostic methodology to measure your own AI resolution rate using your own ticket data, built on RTCI's 72-hour verified resolution standard.
Customer Service Survey Questions: 35 Customer Satisfaction Survey Questions for Services, With AI-Handled and Human Tickets
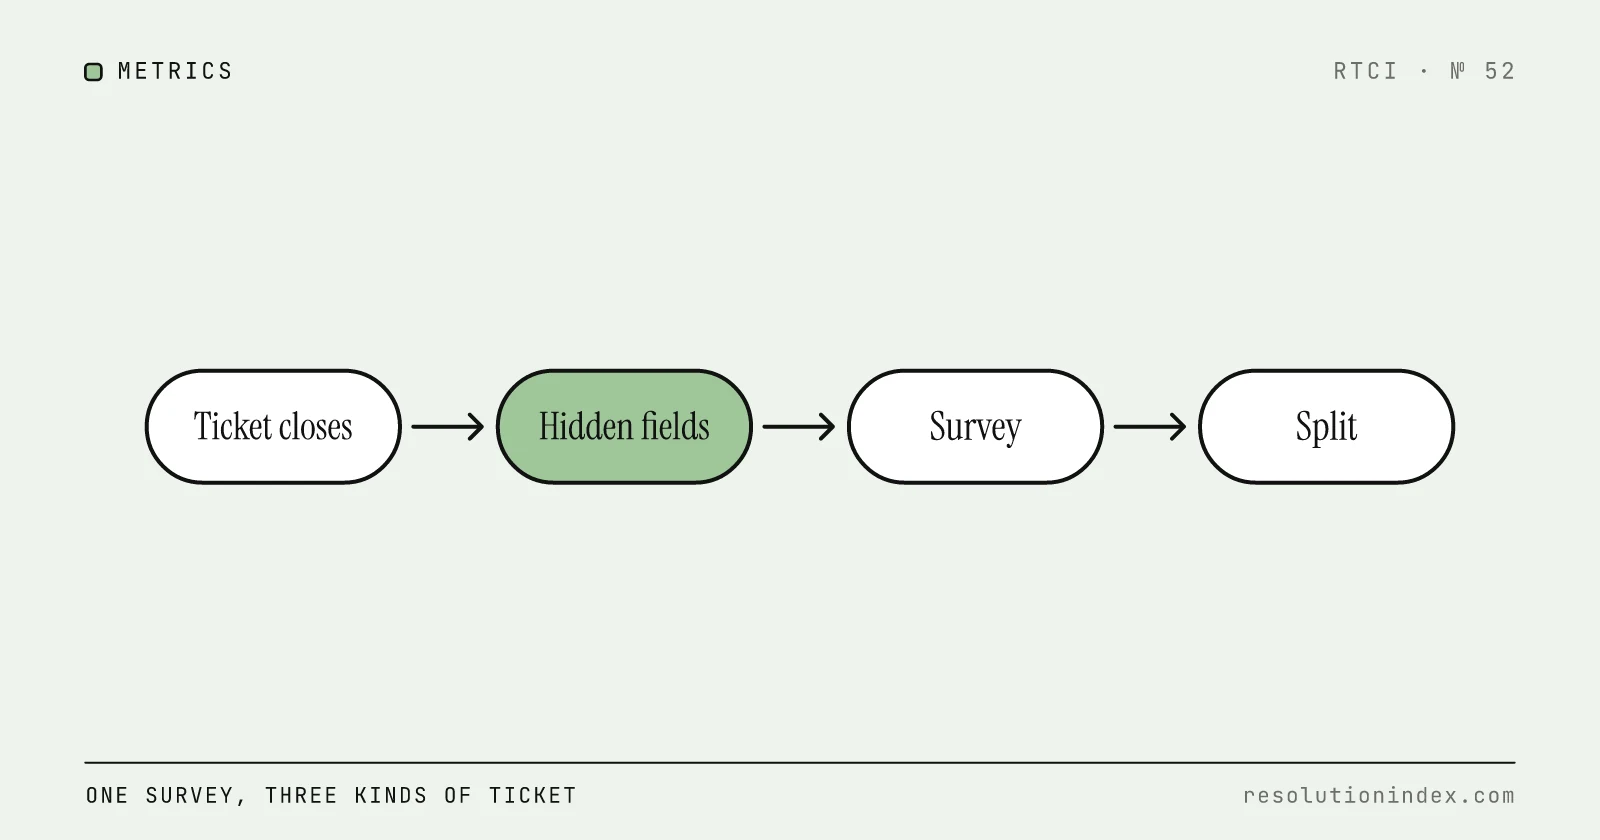
A 35-question bank for the survey that goes out when a support ticket closes: CSAT, effort, yes/no and open-text wording, separate lines for AI-handled and hand-off conversations, the hidden fields to tag, and how many responses a CSAT gap needs before it means anything.
AI Customer Support Agents vs Chatbots: What Changes Operationally?
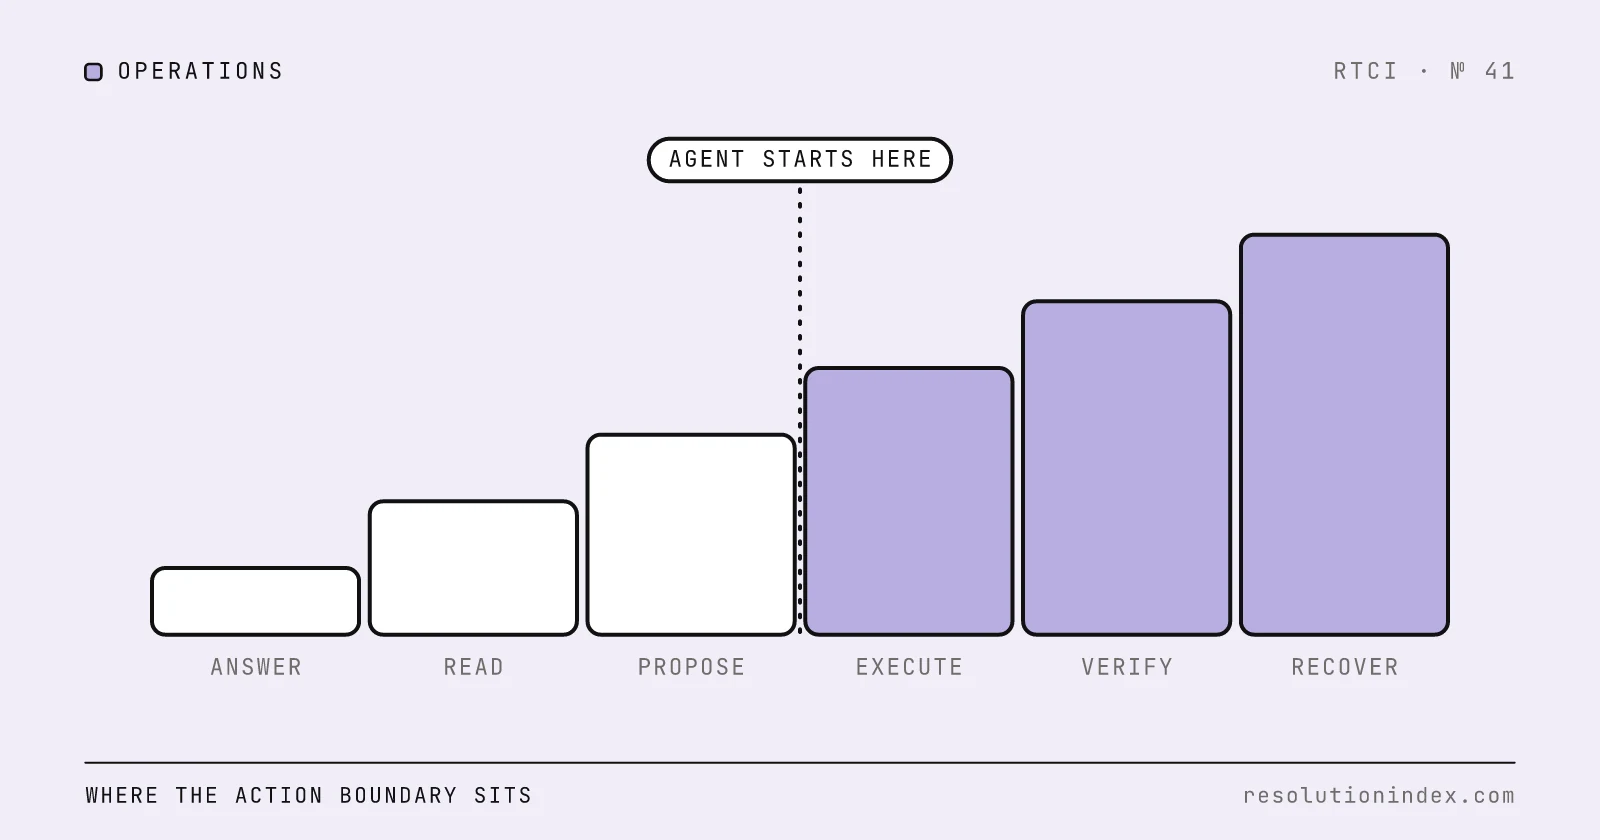
An AI support agent can execute controlled actions in your systems; a chatbot answers. Use this boundary matrix and paired transcript to set approvals, logs, and resolution metrics.