Published Aug 6, 2026 · Updated Nov 19, 2026 · 10 min read
How to Measure AI Resolution Rate Internally
Vendor dashboards report resolution rates that no two vendors calculate the same way. This is a practical, vendor-agnostic methodology to measure your own AI resolution rate using your own ticket data, built on RTCI's 72-hour verified resolution standard.
 Written by Andrew Hall, Editor
How do you measure AI resolution rate?
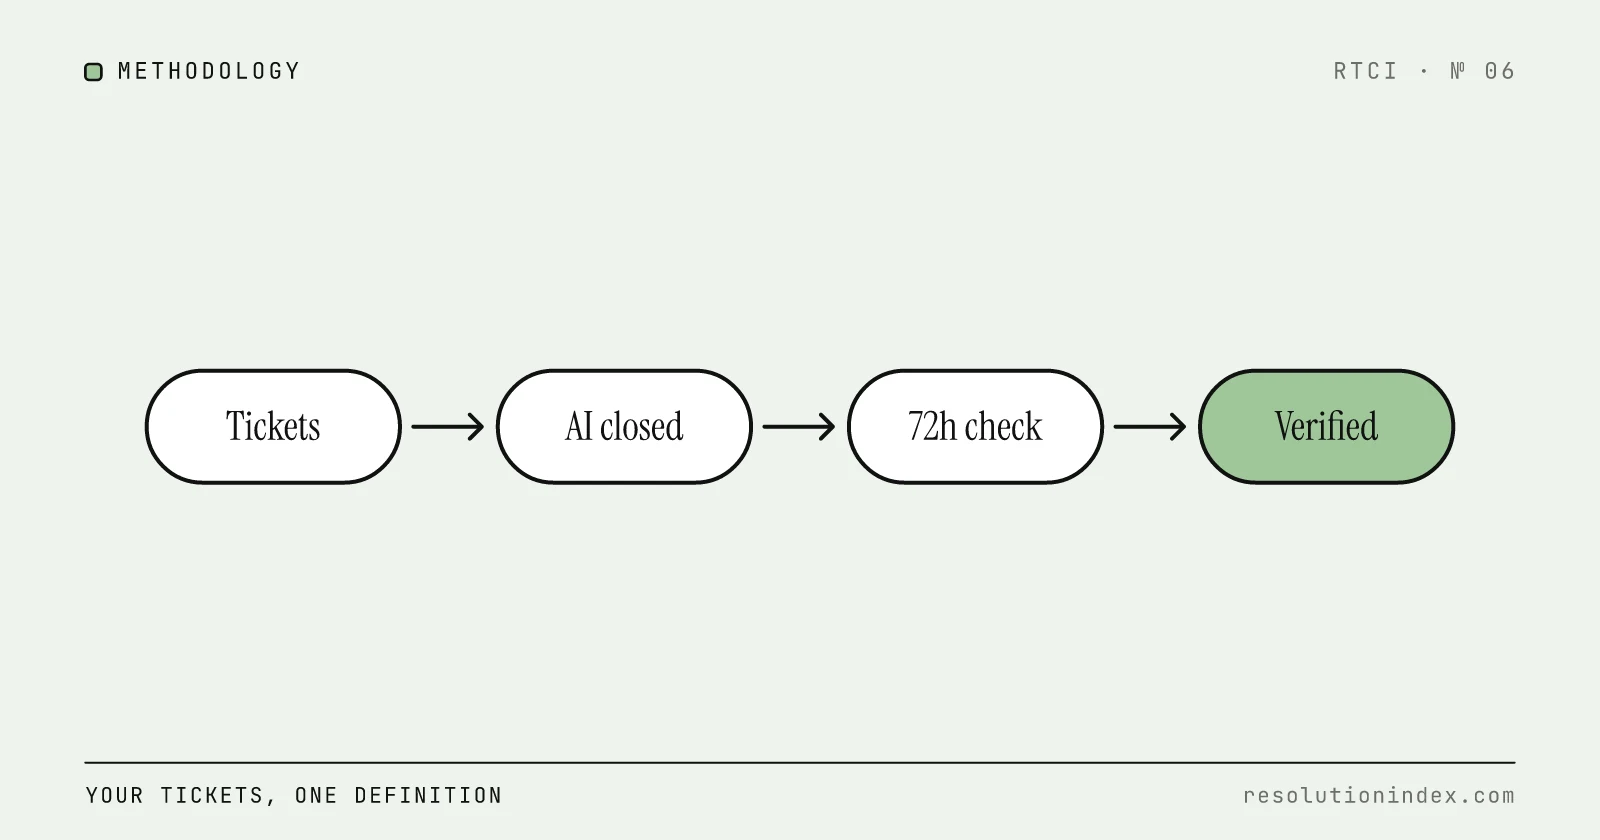
Divide verified AI resolutions by every conversation that reached the AI in the period. A resolution is verified when the AI closed the conversation with no human handoff and the same customer did not come back about the same issue within 72 hours. Build it from your own ticket export: count the conversations that entered the AI's queue, remove the ones escalated to a person, remove the ones followed by a repeat contact inside the window, and divide. This is the definition RTCI uses for realistic ROAR across its index, so your result can be compared with RTCI's estimate for your platform.
Verified AI resolution rate (%) = (AI-closed conversations − escalations − repeat contacts within 72 hours) ÷ conversations that reached the AI × 100
Why can't you use the vendor dashboard number?
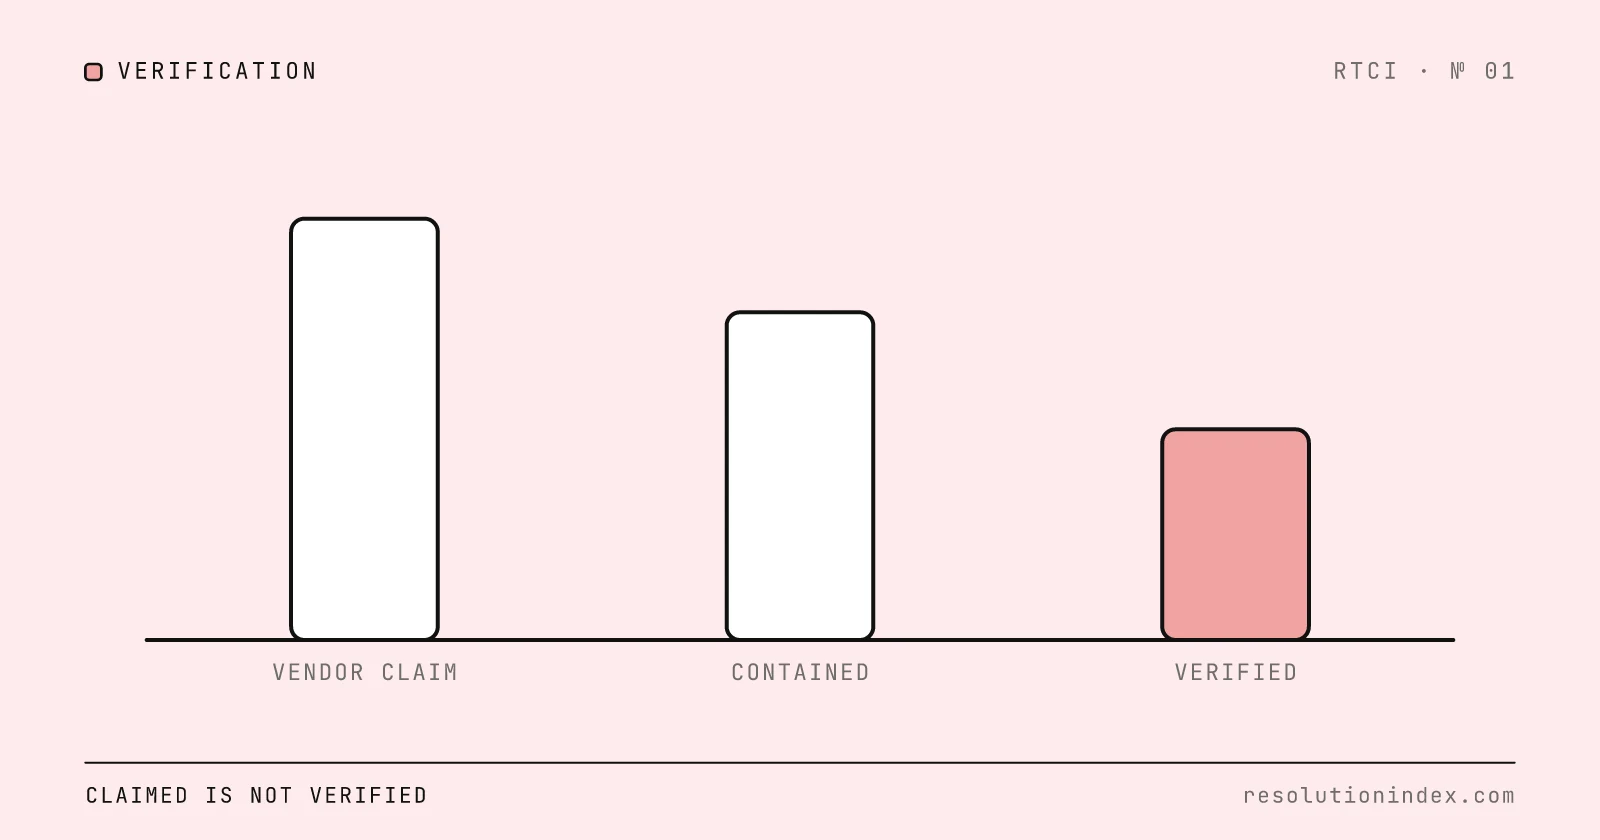
Every AI support vendor ships a dashboard with a resolution rate, and they rarely calculate it the same way. Why Vendor-Claimed Resolution Rates Don't Match Reality covers four common definitions, which produce different numbers from identical performance.
The first counts a conversation as resolved if it closed with no human handoff. The second counts silence: no reply from the customer within a time window that might be an hour or a week and is rarely disclosed. The third uses a status flag the bot sets on itself when it completes a scripted flow, whether or not the flow addressed what the customer asked. The fourth requires explicit confirmation such as a CSAT click, which only covers customers who bother to click.
If your dashboard says 70%, the number may be accurate under its own definition. The question is whether it measures the same thing as the next vendor's 70%. The method below gives you one definition you control.
What counts as a verified resolution?
RTCI applies one definition to all 20 platforms in its index: a resolution counts only if it holds end to end with no human handoff and no customer re-contact within 72 hours. RTCI calls this realistic ROAR (Rate of Autonomous Resolution).
“No human handoff” means the AI handled the conversation from start to close without escalating to an agent. “No re-contact within 72 hours” means the customer did not open a new conversation about the same issue within three days. “Verified” means you confirm both from your own ticket data, not from the vendor's dashboard.
RTCI chose 72 hours because it is long enough to catch a customer who tries the suggested fix, finds it did not work and writes back, and short enough to close a month's numbers a few days after the month ends. Whatever window you pick, fix it in writing and use it for every vendor and every month. The result will usually come in below the vendor dashboard, because it removes closures that did not hold.
What data do you need before you start?
You need four sources. The method still works without all four, but the re-contact check gets less precise.
First, a ticket export for the period with timestamp, customer ID, channel, status, topic or intent tag, and assigned agent. Second, the transcript of each conversation the AI handled, so you can confirm whether a person was involved. Third, escalation records showing which conversations moved from the AI to a person, and when. Fourth, post-conversation CSAT, if you collect it, split by AI-resolved and human-resolved.
Most helpdesks can export all four. If your vendor will not let you export conversation logs or escalation records, treat that as a finding: you cannot audit a number you cannot rebuild.
Step 1: Which conversations go in the denominator?
The denominator moves the headline more than any other choice. Use every conversation that reached the AI during the period, whatever the outcome. Do not use all support conversations, and do not use a pre-filtered “AI-eligible” subset.
If routing rules send billing disputes and security issues straight to people, those conversations never reach the AI and fall outside this denominator. Track that exclusion separately. A 70% rate on 30% of total volume resolves 21% of all tickets; the same 70% on 90% of volume resolves 63%.
Record both numbers: conversations that reached the AI and total support volume. The ratio tells you how much of the queue the AI touches at all, which few vendor dashboards report.
Step 2: Which conversations go in the numerator?
The numerator is the count of conversations the AI resolved without a human handoff and without a re-contact within 72 hours. It takes two checks.
First, did the conversation close without an escalation? Your escalation records answer this. If the escalation timestamp is empty, the AI handled it end to end. If it is filled in, the conversation is not an AI resolution, whatever the dashboard says.
Second, did the same customer come back about the same issue? Join the ticket export to itself on customer ID, and flag any new conversation within 72 hours of the AI's close that carries the same topic or intent tag. Where tags are missing or unreliable, read the flagged pairs by hand. This check catches the failures the dashboard cannot see: the AI closed the conversation, the problem was not solved, and the customer came back, often on another channel.
If you cannot join conversations by customer ID, sample instead. Pull a random set of AI-closed conversations and check each one by hand for a handoff and a repeat contact. The 95% margin of error is 1.96 × √(p × (1 − p) ÷ n): at a true rate near 60% and 200 conversations, that is 1.96 × √(0.24 ÷ 200) ≈ ±6.8 points. Use a sample that size for direction, not for a contract dispute.
Step 3: How should escalations be counted?
A conversation that starts with the AI and ends with a person is not an AI resolution. The AI may have gathered context or narrowed the problem first, but for this metric, count it as a non-resolution. That is the conservative standard RTCI uses.
Track escalations as their own metric, and grade their quality. A clean handoff passes the full context and a summary, so the agent picks up where the AI stopped. A messy one makes the customer repeat everything, which costs agent time and satisfaction. A rising share of messy handoffs usually points to a configuration problem that will also hold the resolution rate down.
If a person resolves the issue after a handoff, count it in your human resolution rate. Some dashboards report these as “AI-assisted resolutions” and fold them into the AI's number. Keep them out.
Step 4: Why segment by ticket type?
One overall rate hides where the AI works. A 60% overall rate could be 85% on password resets and 15% on billing disputes: if password resets are 64% of the AI's volume, 0.64 × 85% + 0.36 × 15% ≈ 60%. Those are two different stories behind one number.
Segment by your top five ticket types, plus channel where it matters, and report resolution rate, re-contact rate and escalation rate for each. That tells you where to widen the AI's scope and where to leave tickets with people. It also keeps vendor comparisons fair: compare two vendors on the same segments, because their overall numbers may reflect different ticket mixes.
Set targets per category from your own baseline, not one company-wide figure. A single overall target does not tell you whether the AI meets expectations on any category, and it moves whenever the ticket mix shifts.
Step 5: How do you track re-contact rate?
Re-contact rate (%) = AI-closed conversations followed by a same-issue contact within 72 hours ÷ AI-closed conversations without a handoff × 100
A rising re-contact rate means the AI is closing conversations without solving them, and those closures are still counted as resolutions on the vendor's dashboard. Report it next to the resolution rate every time; a resolution rate without one is an incomplete claim.
Re-contact is harder to game than any status flag, because it depends on what the customer does next. A vendor can define “resolved” as it likes, but a customer returning with the same problem is an outside signal that the resolution did not hold.
Track it weekly. If it rises, one of three things has usually changed: the ticket mix moved to harder problems, the knowledge base has a gap, or the AI's behavior changed after a model or configuration update.
Worked example: from dashboard rate to verified rate
Assume a month with 8,000 support conversations. Routing sends 2,000 straight to people, so 6,000 reach the AI and the exclusion rate is 2,000 ÷ 8,000 = 25%.
The vendor dashboard marks 4,500 of the 6,000 as resolved: 75%.
The escalation records show an agent replied in 300 of those 4,500, which the dashboard counted as AI-assisted. That leaves 4,200 closed with no handoff.
The re-contact join finds 420 of the 4,200 customers came back about the same issue within 72 hours. Re-contact rate: 420 ÷ 4,200 = 10%. Verified resolutions: 4,200 − 420 = 3,780.
Verified AI resolution rate: 3,780 ÷ 6,000 = 63%. Share of total support volume resolved by the AI: 3,780 ÷ 8,000 = 47.25%.
Cost: assume the platform charges $1 for each of the 4,500 conversations it marked resolved plus a $1,000 monthly fee, so $5,500. On the dashboard count that is $5,500 ÷ 4,500 ≈ $1.22 per resolution. Per verified resolution it is $5,500 ÷ 3,780 ≈ $1.46.
What belongs on the dashboard, and how often?
Review the numbers at three cadences. Weekly is for operational tuning, monthly for management reporting, quarterly for decisions about scope, renewal and alternatives.
Weekly: conversations reaching the AI, verified AI resolution rate, 72-hour re-contact rate, escalation rate, and the top five ticket types with a resolution rate for each. Decide before launch how large a week-over-week drop triggers an investigation, and write it down. The usual causes are a knowledge-base gap, a routing change or a new ticket type the AI has not been set up for.
Monthly: everything weekly, plus CSAT on AI-resolved conversations reported separately from human CSAT, cost per verified resolution, average resolution time and escalation quality. Blending AI and human CSAT hides the AI's score on easy tickets and the team's score on hard ones. If you also report first contact resolution, the split mode of the FCR calculator separates AI and human first-contact results.
Quarterly: everything monthly, plus the trend over the quarter, a comparison with your pre-AI baseline, a comparison with RTCI's realistic ROAR for your platform, and a review of which ticket types to add to or remove from the AI's scope.
Which measurement mistakes inflate the number?
Self-graded flags: the AI sets its own “resolved” status when it completes a scripted flow. Completing the wrong flow confidently still sets the flag. Cross-check with re-contact data.
Silence as resolution: the customer did not reply within the vendor's window, so the conversation auto-closed. Silence can mean the customer was satisfied, gave up or switched channels. The 72-hour re-contact check catches the last case.
Credit on handoff: a conversation that started with the AI and ended with a person is logged as an “AI-assisted resolution”. Count it as an escalation and a human resolution.
Blended CSAT: AI-resolved and human-resolved scores averaged into one. The AI usually takes the easier tickets, so the blend hides both numbers.
Ignored exclusions: if 40% of tickets never reach the AI because of routing rules, the AI's rate describes the other 60%. Report the exclusion rate next to the resolution rate.
Template: resolution rate audit worksheet
Use this checklist to audit your own AI resolution rate with any vendor.
- Export all conversations from the measurement period (at least 30 days).
- Separate conversations that reached the AI from those that did not. Record the exclusion rate.
- For each AI-handled conversation, check whether it was escalated to a person. Escalated conversations are not AI resolutions.
- For each non-escalated conversation, check whether the same customer opened a new conversation about the same issue within 72 hours. Re-contacted conversations are not verified resolutions.
- Divide verified resolutions by AI-handled conversations. This is your verified AI resolution rate.
- Segment by the top five ticket types. Record resolution rate, re-contact rate and escalation rate for each.
- Measure CSAT for AI-resolved conversations separately from human-resolved ones.
- Calculate cost per verified resolution: total AI platform costs plus per-resolution charges, divided by verified resolutions.
- Compare your verified rate with RTCI's realistic ROAR for your platform in the index.
- Run your numbers through the Cost per Verified Resolution Calculator to compare alternative platforms at your volume.
Keep the window and the definitions fixed, write them down, and apply them the same way to every vendor you compare.
Frequently asked questions
What is a verified AI resolution?
A conversation the AI closed with no human handoff, where the same customer did not come back about the same issue within 72 hours. Both conditions are checked against your own ticket export and escalation records, not the vendor's status field.
What is the formula for AI resolution rate?
Verified AI resolutions ÷ conversations that reached the AI × 100. In the worked example in this guide, 3,780 verified resolutions out of 6,000 AI conversations is 63%, against 75% on the vendor dashboard.
Should escalated conversations count as AI resolutions?
No. A conversation that started with the AI and ended with a person is an escalation and, if the person solved it, a human resolution. Track escalation quality separately, because clean handoffs cost less than ones where the customer repeats everything.
What if I can't link repeat contacts to the original ticket?
Hand-check a random sample of AI-closed conversations instead. At a true rate near 60%, 200 checked conversations give a 95% margin of error of about ±6.8 points, so use the sample for direction and the full join once your data allows it.
Change log
- Removed third-party statistics and vendor-report citations that could not be traced to a source, added a worked example with every step shown and a sampling fallback, and moved the answer to the top.
- Published.
Read next
Keep reading
Picked for this article: the pieces it cites and the ones that answer the next question buyers usually ask.
Most related
AI Resolution Rates: Why Vendor Claims Are Often Inflated
See how AI support vendors blur resolution, containment and deflection, how RTCI discounts each claim, and the five questions to ask before you compare two rates.
Resolution Rate vs. Deflection Rate: What's the Difference?
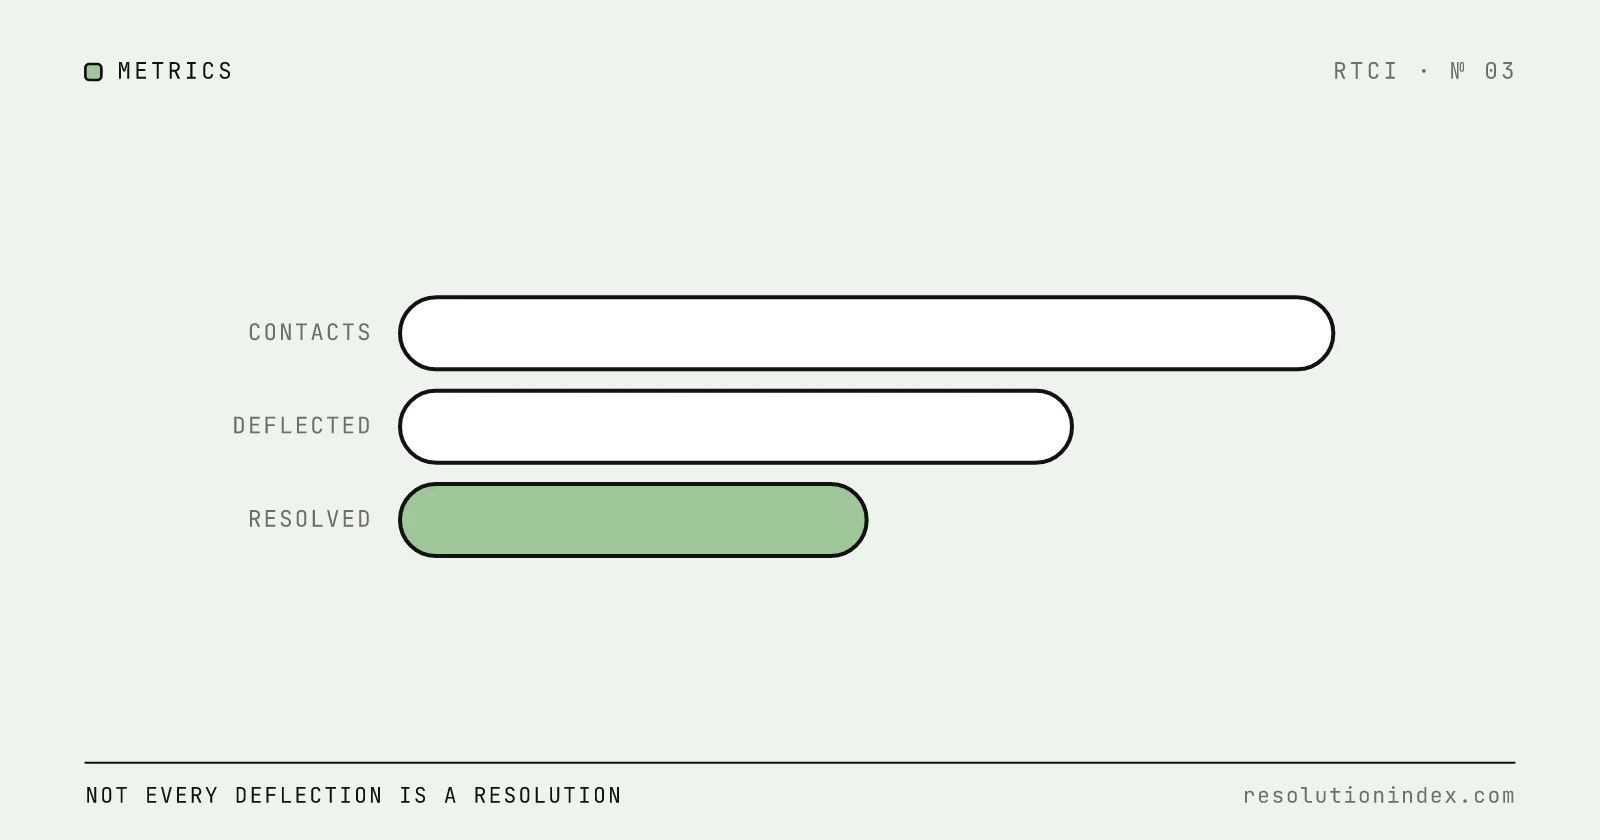
Resolution rate measures issues solved end to end; deflection rate measures contacts avoided. Learn the formulas, see examples, and stop vendors from blending them.
Good AI Resolution Rate: 2026 Benchmarks (45–70%)
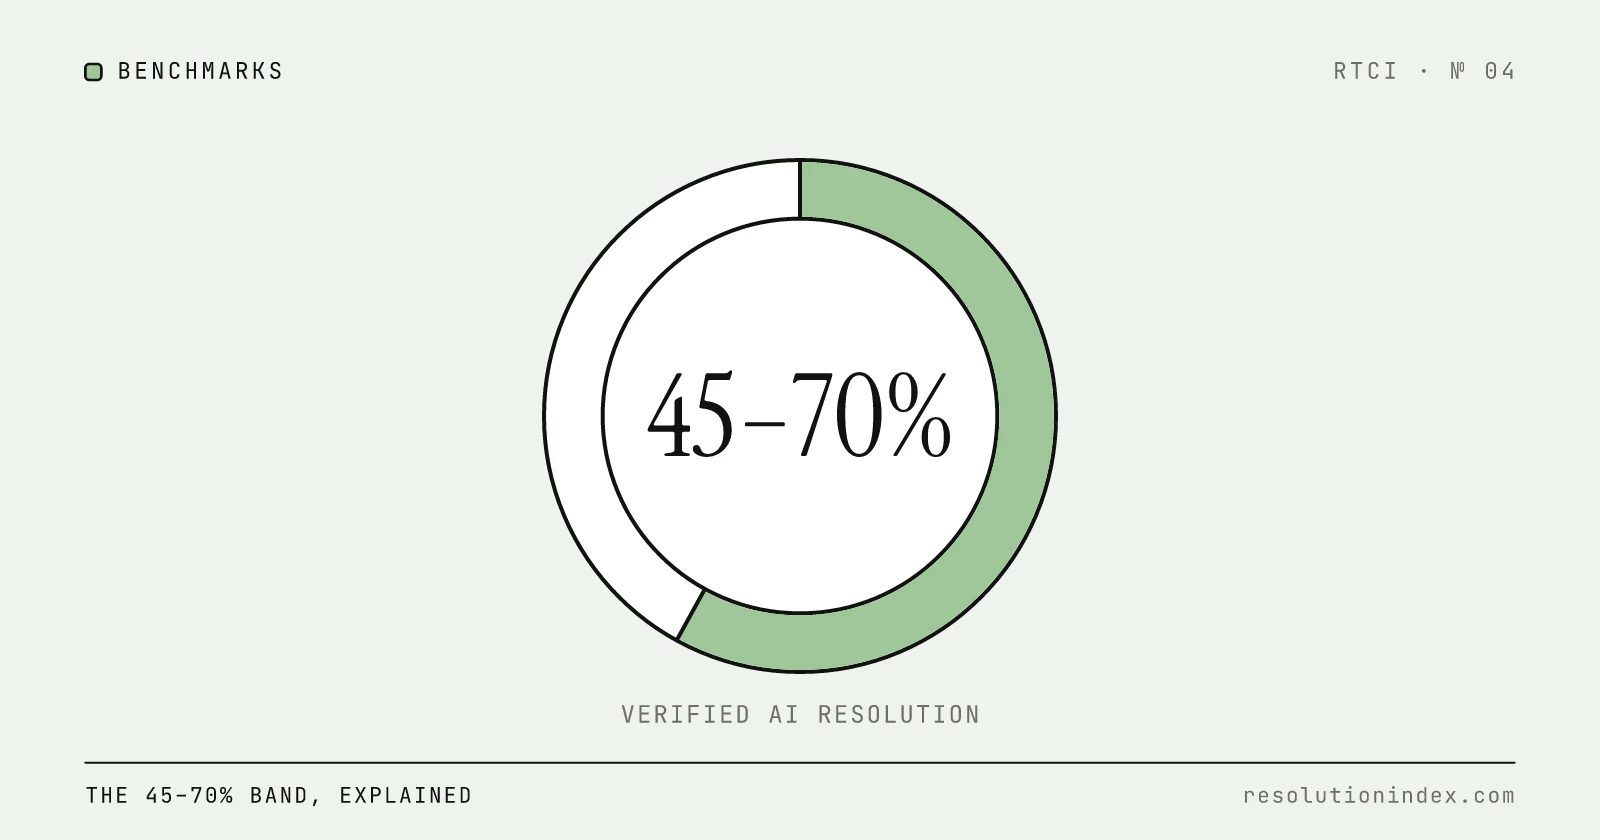
A 45–70% realistic AI resolution rate is good for most support teams; above 70% is excellent. 13 of the 20 platforms in RTCI's index land in that band, and the median is 58%.
Outcome-Based vs Seat-Based Pricing for AI Support: Which Model Should You Buy In 2026?
A buyer-side guide to choosing between outcome-based and seat-based AI support pricing in 2026, with current rates for Intercom Fin, Salesforce Agentforce, HubSpot Breeze, Zendesk AI and Freshdesk Freddy, a worked cost per verified resolution example, and a contract checklist.
Why Resolution Stalls Around 45%: Diagnostics and Fixes
When verified AI resolution flattens in the 40s, the cause is usually one of five operational gaps. A five-question test finds yours, and each cause has its own fix.