Published Aug 12, 2026 · Updated Nov 19, 2026 · 13 min read
First-Contact vs End-to-End Resolution
A metric decision guide for AI support teams: when to use first-contact resolution rate vs end-to-end resolution rate, how to track both, and how deflection fits into the same dashboard.
 Written by Andrew Hall, Editor
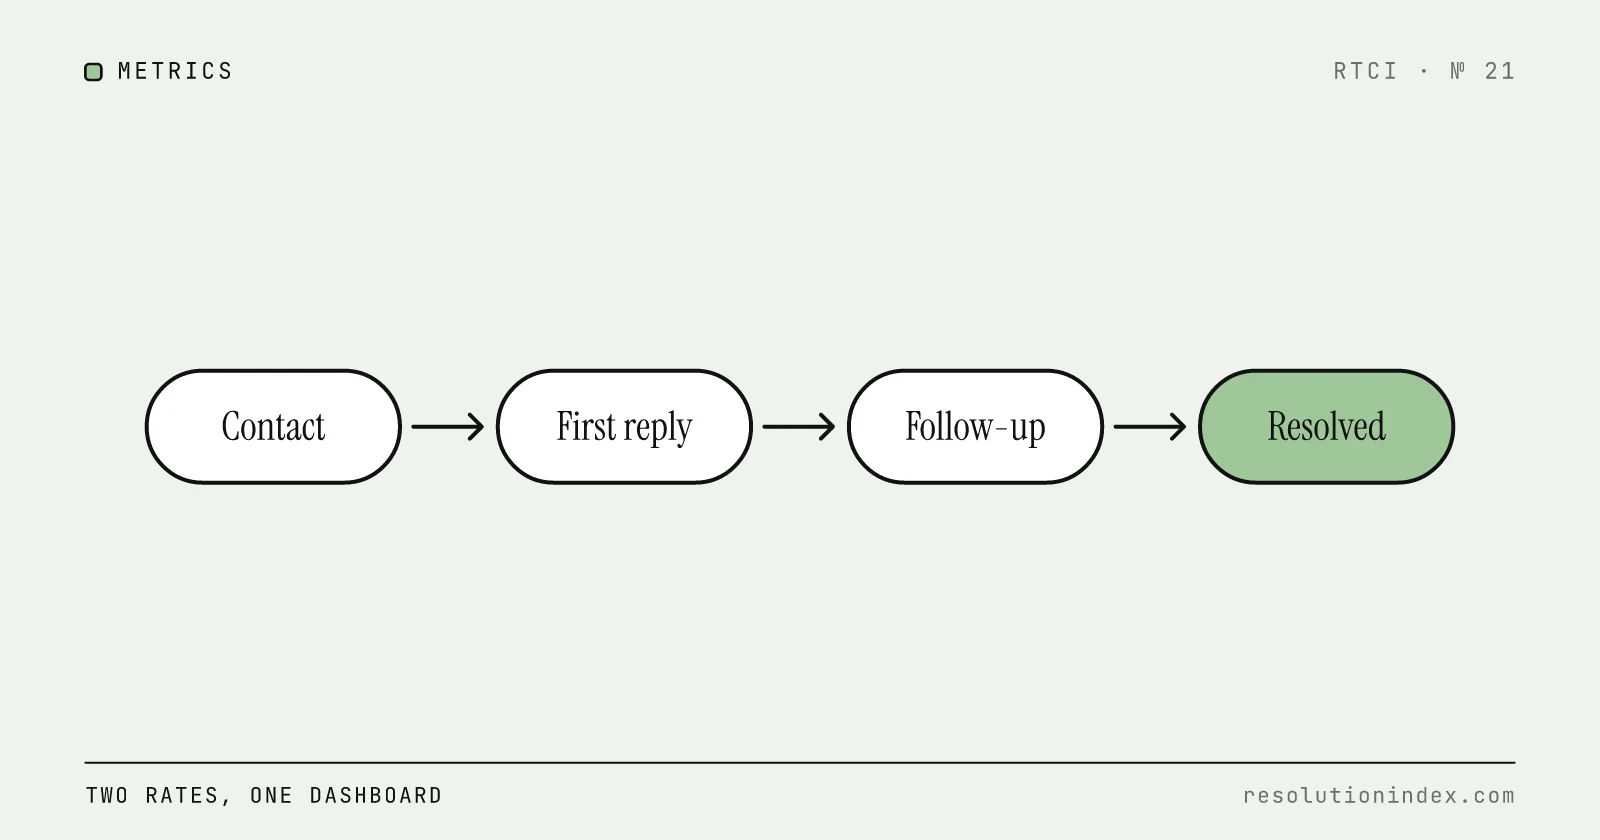
What is the difference between first-contact and end-to-end resolution?
First-contact resolution (FCR) asks whether the issue was solved in the first interaction, with no transfer, escalation or repeat contact inside a set window. End-to-end resolution asks whether the AI solved the whole case with no human involvement and no reopen inside your verification window, however many turns or contacts it took. FCR measures the quality of the conversation layer and belongs to the team tuning it. End-to-end resolution on total volume measures how much work the AI takes off people and belongs to finance and vendor reviews. Track both, and keep deflection, which counts contacts that never became tickets, on its own line.
Why does the distinction matter?
Deflection rate, resolution rate and FCR often appear side by side in AI support marketing as if they were interchangeable. A buyer comparing two platforms can be misled if one vendor reports FCR and the other reports end-to-end resolution. A high FCR on a narrow set of AI-eligible tickets can look excellent while the AI touches only 30% of total volume. A high end-to-end rate can look excellent while customers wait through long conversations because the bot avoids escalating.
RTCI's benchmark, realistic ROAR, is an end-to-end standard: a resolution counts only if it holds with no human handoff and no customer re-contact within 72 hours. It is the common definition across every platform in the index.
What does first-contact resolution rate measure?
FCR is the oldest resolution metric in contact-center operations. It measures the share of issues fully resolved in the first interaction, with no follow-up, transfer, escalation or repeat contact within a defined window. For an AI agent it is usually applied to the conversations the AI is allowed to handle: of those first AI touches, how many closed the issue in one go?
FCR (%) = (issues resolved on first contact ÷ total first-contact issues) × 100
The ambiguity is in the denominator. A strict definition counts every issue that reaches the AI. A friendlier one counts only issues the AI was expected to resolve. If routing filters out billing disputes, security issues and emotional escalations before the AI sees them, the AI's FCR describes a curated subset. That is fine for tuning, but it says nothing about the whole operation. The first contact resolution calculator works out gross and net FCR, and the blend of AI and human first-contact resolutions, from your own counts.
The most widely cited FCR benchmarks come from SQM Group, which surveys customers of inbound call centers within one business day of the call. SQM's 2022 results put the industry average at 71%, rate 70% to 79% as good, and find only 5% of call centers at its “world-class” level of 80% or higher. These are customer survey results from centers staffed by people. An AI agent's first-touch rate is measured differently, and there is no comparable public benchmark for it, so use SQM's figures as a reference for your human queue and compare the AI's FCR with its own trend under a fixed rule.
What does end-to-end resolution rate measure?
End-to-end resolution rate measures the share of support cases resolved start to finish by the AI, with no human involvement and no reopening. It answers: of everything that came in, how much did the AI actually handle?
End-to-end resolution rate (%) = (cases fully resolved by AI with no handoff or reopen ÷ total support cases) × 100
The denominator is the most important choice. Total support volume gives the honest coverage number. AI-eligible volume inflates it. AI-touched volume sits between the two. Ask which one is in use before comparing rates.
Per-outcome pricing does not map neatly onto any of them. Intercom Fin bills $0.99 per outcome, and an outcome covers resolutions plus procedure handoffs, disqualifications and self-serve routings, so the billed count is not the resolved count. Zendesk has billed AI agents on automated resolution tiers since May 18, 2026 (assisted escalation, contained resolution and verified resolution), and charges $1.50 per automated resolution on a committed volume or $2.00 pay-as-you-go. Read each vendor's definition next to its invoice.
For a reference range, RTCI's realistic estimates for a mid-market deployment with average knowledge-base quality run from 27–37% for Gorgias AI to 62–72% for Forethought, measured end to end on conversations that reached the AI. Each platform's figure is in the index, and What Is a Good AI Resolution Rate? sets out target bands.
How do FCR and end-to-end resolution compare?
| Dimension | First-contact resolution rate (FCR) | End-to-end resolution rate |
|---|---|---|
| Question it answers | Did the first AI or agent touch close the issue? | What share of support volume did the AI fully handle? |
| Typical denominator | Issues that reached the AI or first contact point | Total support volume, AI-eligible volume or AI-touched volume |
| Human handoff allowed? | No, for the issue to count | No, for the case to count |
| Multiple contacts allowed? | No | Yes, if no person was involved |
| Repeat-contact window | Set by you; a longer window gives a lower rate | Set by you; RTCI uses 72 hours |
| Best used for | Conversation quality, AI and agent tuning, escalation analysis | Vendor performance, automation ROI, capacity planning |
| Published reference point | SQM Group 2022: 71% industry average (post-call surveys, human call centers) | RTCI estimates: Gorgias AI 27–37% to Forethought 62–72% |
| Primary owner | AI and quality team, contact-center operations | Finance, vendor management, automation program lead |
| Risk of gaming | Premature closure, avoiding hard cases | Narrow denominator, counting handoffs as AI resolutions |
Worked example: one queue, four headlines
Assume 10,000 support conversations in a month. Routing sends 4,000 simple, high-confidence cases to the AI and 6,000 straight to people. Of the 4,000 AI cases, 400 escalate to a person mid-conversation, 600 end without a resolution or a handoff, and the AI closes 3,000. Within 72 hours, 300 of those 3,000 customers come back about the same issue. The AI resolves 100 of the returns on its own and hands 200 to people.
- Vendor dashboard (closed without handoff ÷ AI-touched) = 3,000 ÷ 4,000 = 75%. No re-contact check.
- AI FCR on AI-touched volume = (3,000 − 300 returns) ÷ 4,000 = 67.5%. Solved in the first conversation with no repeat contact.
- End-to-end resolution on AI-touched volume = (2,700 + 100 resolved on the second contact) ÷ 4,000 = 70%. The fair number for comparing AI vendors, if all use the same denominator and window.
- End-to-end resolution on total support volume = 2,800 ÷ 10,000 = 28%. The share of the whole operation the AI carried.
A CFO modeling headcount needs the 28%. A vendor comparison needs the 70%. A quality lead needs the 67.5% FCR and the 300 returns, which show where the first answer did not hold. The 75% on the dashboard is the only one of the four that no stakeholder should use.
Which metric should you use?
- Are you choosing or evaluating an AI vendor? → Use end-to-end resolution on AI-handled volume, with the same re-contact window for every vendor. Compare it with RTCI's realistic ROAR in the index.
- Are you building the internal AI and quality roadmap? → Use FCR segmented by ticket type and channel. It shows where the first AI touch fails and where escalations cluster.
- Are you reporting to finance or the board? → Use end-to-end resolution on total support volume plus cost per verified resolution. That ties automation to headcount and budget.
- Are you planning self-service investments? → Use deflection rate, separately from resolution. Track how many inquiries never become tickets, but do not let deflection stand in for resolved cases.
- Are you running a pilot? → Report FCR on AI-touched volume, end-to-end resolution on total volume and deflection rate, plus re-contact rate, escalation rate and AI-only CSAT.
Report only one number and the team will optimize it at the expense of the others. A team chasing FCR may route hard tickets away from the AI. A team chasing end-to-end resolution may tolerate long, repetitive conversations that hurt CSAT.
Which formulas and companion metrics go with them?
The window can vary by business, but fix it and disclose it, inside your organization and in vendor conversations.
FCR (%) = (first-contact resolutions ÷ first-contact attempts) × 100
End-to-end AI resolution rate (%) = (verified AI resolutions ÷ chosen denominator) × 100
Re-contact rate (%) = (reopened or re-contacted cases within the window ÷ cases closed as resolved) × 100
Deflection rate (%) = (inquiries handled by self-service without becoming a ticket ÷ total inbound attempts) × 100
Cost per verified resolution (CPVR) = total AI platform costs ÷ verified AI resolutions
A verified resolution requires all of these: the AI handled the conversation start to finish, no person was involved, the customer did not return with the same issue within the window, and the case was not closed by silence alone.
How to Measure AI Resolution Rate defines verified resolution step by step, including a sampling method for when your helpdesk cannot link repeat contacts to the original ticket.
Which stakeholders own which metric?
Reporting one aggregate number to everyone creates confusion. Each part of the business needs a different view.
| Stakeholder | Primary metric | Why it matters |
|---|---|---|
| CFO / finance | End-to-end resolution on total volume + CPVR | How much human work the AI replaces and what each real outcome costs. |
| VP support / operations | FCR by ticket type + escalation rate | Where the AI is strong and where people still carry the load. |
| AI and quality team | FCR + re-contact rate + wrong-answer rate | What to fix in knowledge, routing, prompts and tool access. |
| Vendor management | End-to-end resolution on AI-handled volume with a vendor-neutral window | A fair comparison that holds every vendor to one standard. |
| Product / self-service owner | Deflection rate + help-center search success | Whether documentation and in-app guidance reduce ticket volume. |
| Compliance / risk | Verified resolution + critical-error rate | Whether the AI resolves safely as well as quickly. |
| Customer experience lead | AI-only CSAT + re-contact rate + FCR | Whether customers feel the issue was solved the first time. |
Give each metric a named owner and report them side by side. When one dashboard owns all of them, the pull toward a single flattering percentage is strong.
How does deflection relate to FCR and end-to-end resolution?
Deflection sits upstream of both. It counts customers who found an answer through self-service before a support conversation existed: a help article, a tutorial, or a suggested answer accepted without opening a ticket.
It is useful for capacity planning, because deflected contacts never reach the AI or human queues. It says nothing about how well the remaining contacts were resolved.
Continuing the worked example: assume a further 3,000 inquiries ended in self-service before becoming tickets, so there were 13,000 inbound attempts in all. A combined “AI and self-service handled” figure would be (3,000 + 2,800) ÷ 13,000 ≈ 44.6%. Deflection alone is 3,000 ÷ 13,000 ≈ 23.1%, and the AI resolved 28% of tickets and 70% of the conversations it touched. The 44.6% is useful only to the self-service owner, and only once it is split back into its parts.
Resolution Rate vs. Deflection Rate covers this in depth. Report deflection and resolution as two lines, and never credit the conversational AI for work a help-center article did.
Worked example: comparing two vendors on both metrics
Assume you are comparing Intercom Fin and Zendesk AI for the same 10,000-conversation queue, and both get the same 4,000 conversations so the denominators match. Use RTCI's realistic ROAR midpoints as the resolution rate: 60.8% for Intercom Fin and 40.8% for Zendesk AI. Assume each vendor bills every conversation it closes without a handoff, and that 10% of those closures fail the 72-hour check.
| Metric | Intercom Fin | Zendesk AI |
|---|---|---|
| Conversations reaching the AI | 4,000 | 4,000 |
| Verified resolutions (RTCI midpoint) | 2,432 (60.8%) | 1,632 (40.8%) |
| Verified share of total volume | 24.3% | 16.3% |
| Billed closures (verified ÷ 0.9) | about 2,702 | about 1,813 |
| Per-unit price | $0.99 per outcome | $1.50–$2.00 per automated resolution |
| AI charges | about $2,675 | about $2,720–$3,627 |
| Cost per verified resolution | about $1.10 | about $1.67–$2.22 |
The math: verified ÷ 0.9 gives billed closures (2,432 ÷ 0.9 ≈ 2,702), and price ÷ 0.9 gives cost per verified resolution ($0.99 ÷ 0.9 = $1.10). Seats are left out: Fin needs a $19 Intercom seat, or a 50-outcome monthly minimum when it runs on another helpdesk, and Zendesk seats start at $19 per agent per month on Support Team. Fin outcomes also include procedure handoffs and routings, which would raise its billed count.
The midpoints are RTCI estimates for a typical mid-market deployment, not a measurement of your queue. Run the same table with your own pilot numbers. For the full platform comparison, see Intercom Fin vs. Zendesk AI.
How do you track both metrics on one dashboard?
Keep the numbers on separate lines. At minimum, report:
- Deflection rate on total inbound attempts (self-service only).
- FCR on AI-touched and human-touched volume separately.
- End-to-end resolution rate on both AI-handled volume and total support volume.
- Re-contact / reopen rate within 72 hours for AI-resolved cases.
- CPVR using fully loaded AI costs and verified resolutions.
- AI-only CSAT measured separately from human CSAT.
Segment by your top five ticket types. A blended FCR can hide large differences: 70% on password resets and 25% on billing disputes averages to 55% if password resets are two-thirds of the volume (0.67 × 70% + 0.33 × 25% ≈ 55%). The split mode of the FCR calculator reports a strict blended FCR, the AI's first-touch rate and human FCR side by side.
If you are running a pilot, write the definitions down before kickoff: the re-contact window, the denominator for end-to-end resolution, and what counts as a human handoff. Changing them mid-pilot breaks the trend line. RTCI's standard, 72 hours with no human handoff and no re-contact, is on the methodology page.
Which mistakes make the combined numbers misleading?
The most expensive mistake is letting a vendor or internal dashboard add deflection and resolution into one number. The others:
- Narrow denominator: reporting end-to-end resolution only on AI-eligible tickets. The rate looks high and hides how little of the operation the AI covers.
- Different windows: comparing a vendor's 24-hour re-contact window with your 72-hour one. A shorter window catches fewer repeat contacts, so it reports a higher rate.
- Handoff credit: counting cases that started with the AI and ended with a person as AI resolutions. They are escalations.
- Silence as success: auto-closing a conversation because the customer did not reply, then counting it as FCR. The re-contact check catches this.
- Blended CSAT: mixing AI-resolved and human-resolved satisfaction scores. The AI usually handles easier tickets, so the blend flatters the AI and understates the team.
Each makes a platform look better without changing what the customer experienced. Audit for them quarterly.
Where to go next
For the step-by-step measurement method, read How to Measure AI Resolution Rate. For the deflection trap, see Resolution Rate vs. Deflection Rate. For target bands, see What Is a Good AI Customer Support Resolution Rate?, and to price the result, use the Cost per Verified Resolution Calculator.
Frequently asked questions
Is FCR the same as end-to-end resolution?
No. FCR asks whether the first interaction solved the issue. End-to-end resolution asks whether the AI solved the whole case with no human involvement, however many contacts it took, and it is usually reported against a wider denominator.
What is a good first contact resolution rate?
For human call centers, SQM Group's 2022 post-call survey results put the industry average at 71%, rate 70% to 79% as good, and find only 5% of centers at 80% or higher. There is no comparable public benchmark for an AI agent's FCR, so compare yours with its own trend under a fixed rule.
Which metric should I report to the board?
End-to-end resolution on total support volume, plus cost per verified resolution. Together they show how much work the AI takes off people and what each real outcome costs.
Can a platform have high FCR but low end-to-end resolution on total volume?
Yes. If the AI only gets easy cases and everything hard is routed to people, its FCR on the conversations it touches can be high while its share of all resolved volume stays low.
Should deflection rate ever be added to resolution rate?
No. Deflection happens before a ticket exists. Adding it credits the AI for work the help center did and hides the real automation rate.
What re-contact window should I use?
RTCI uses 72 hours for end-to-end resolution. A longer window catches more repeat contacts and gives a lower rate, so the exact length matters less than using the same one for every vendor and every month.
What is a good end-to-end AI resolution rate?
It depends on ticket mix. RTCI's realistic estimates for a mid-market deployment run from 27–37% for Gorgias AI to 62–72% for Forethought. See What Is a Good AI Customer Support Resolution Rate? for target bands.
Change log
- Replaced unsourced FCR and AI resolution benchmarks with SQM Group’s published survey figures and RTCI’s own index ranges, rebuilt the vendor comparison on RTCI midpoints, and fixed the worked examples so FCR excludes repeat contacts.
- Published.
Read next
Keep reading
Picked for this article: the pieces it cites and the ones that answer the next question buyers usually ask.
Most related
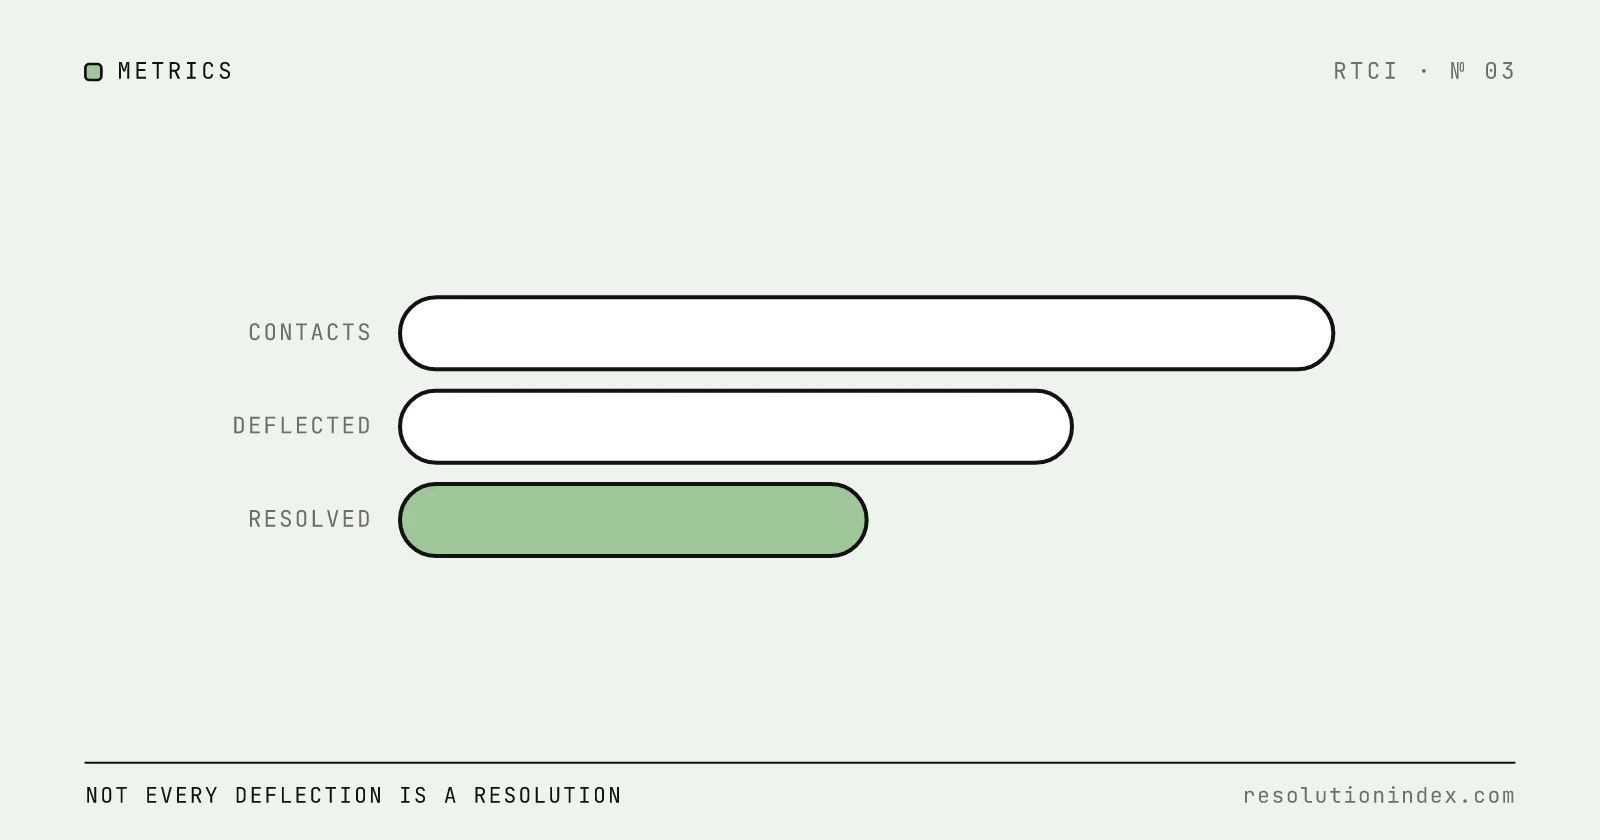
Resolution Rate vs. Deflection Rate: What's the Difference?
Resolution rate measures issues solved end to end; deflection rate measures contacts avoided. Learn the formulas, see examples, and stop vendors from blending them.
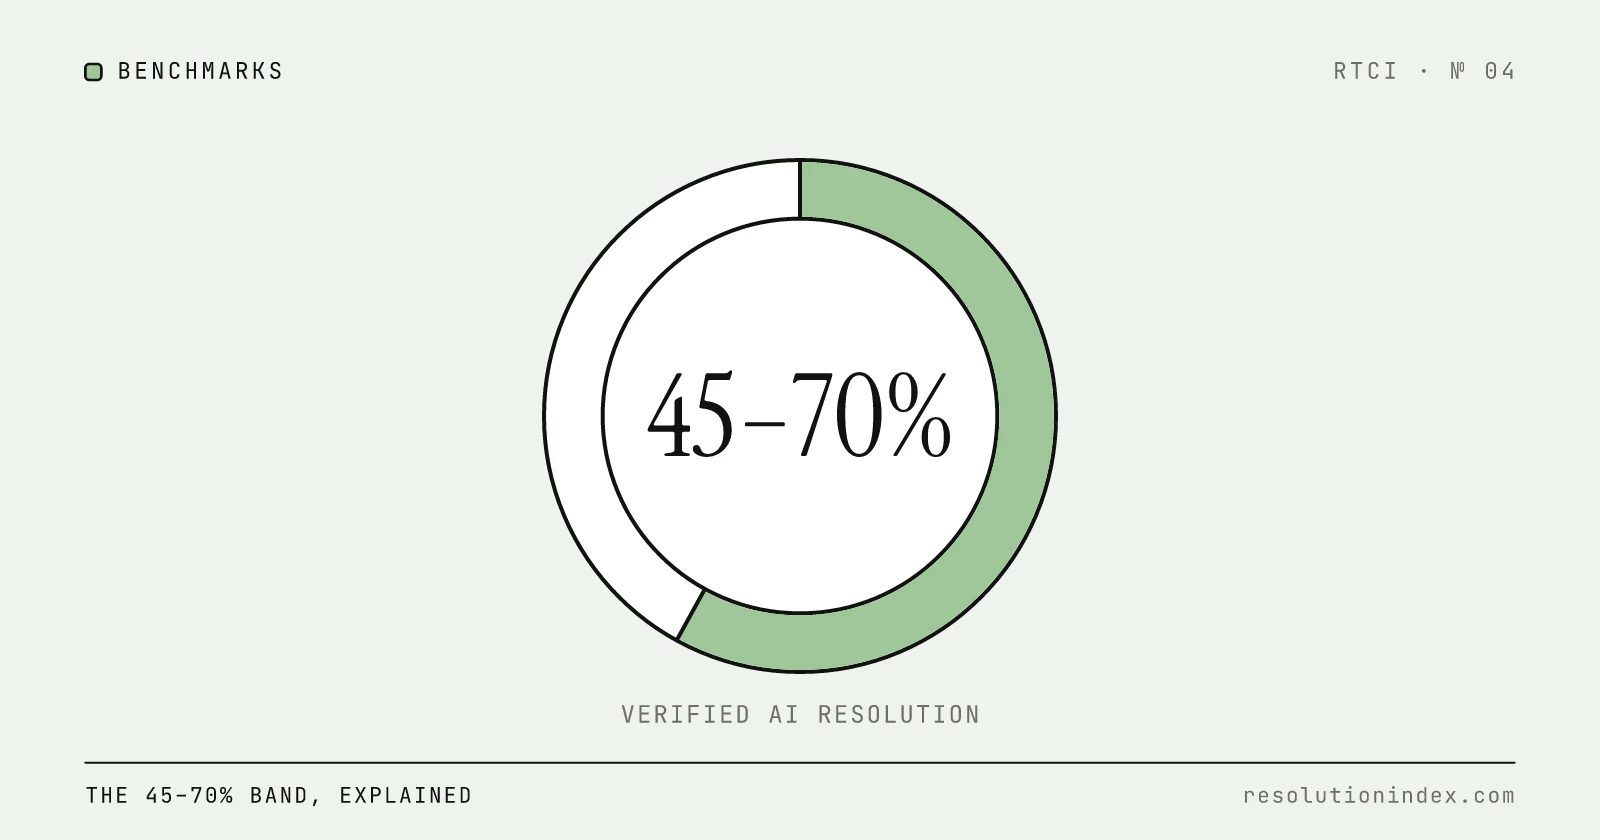
Good AI Resolution Rate: 2026 Benchmarks (45–70%)
A 45–70% realistic AI resolution rate is good for most support teams; above 70% is excellent. 13 of the 20 platforms in RTCI's index land in that band, and the median is 58%.
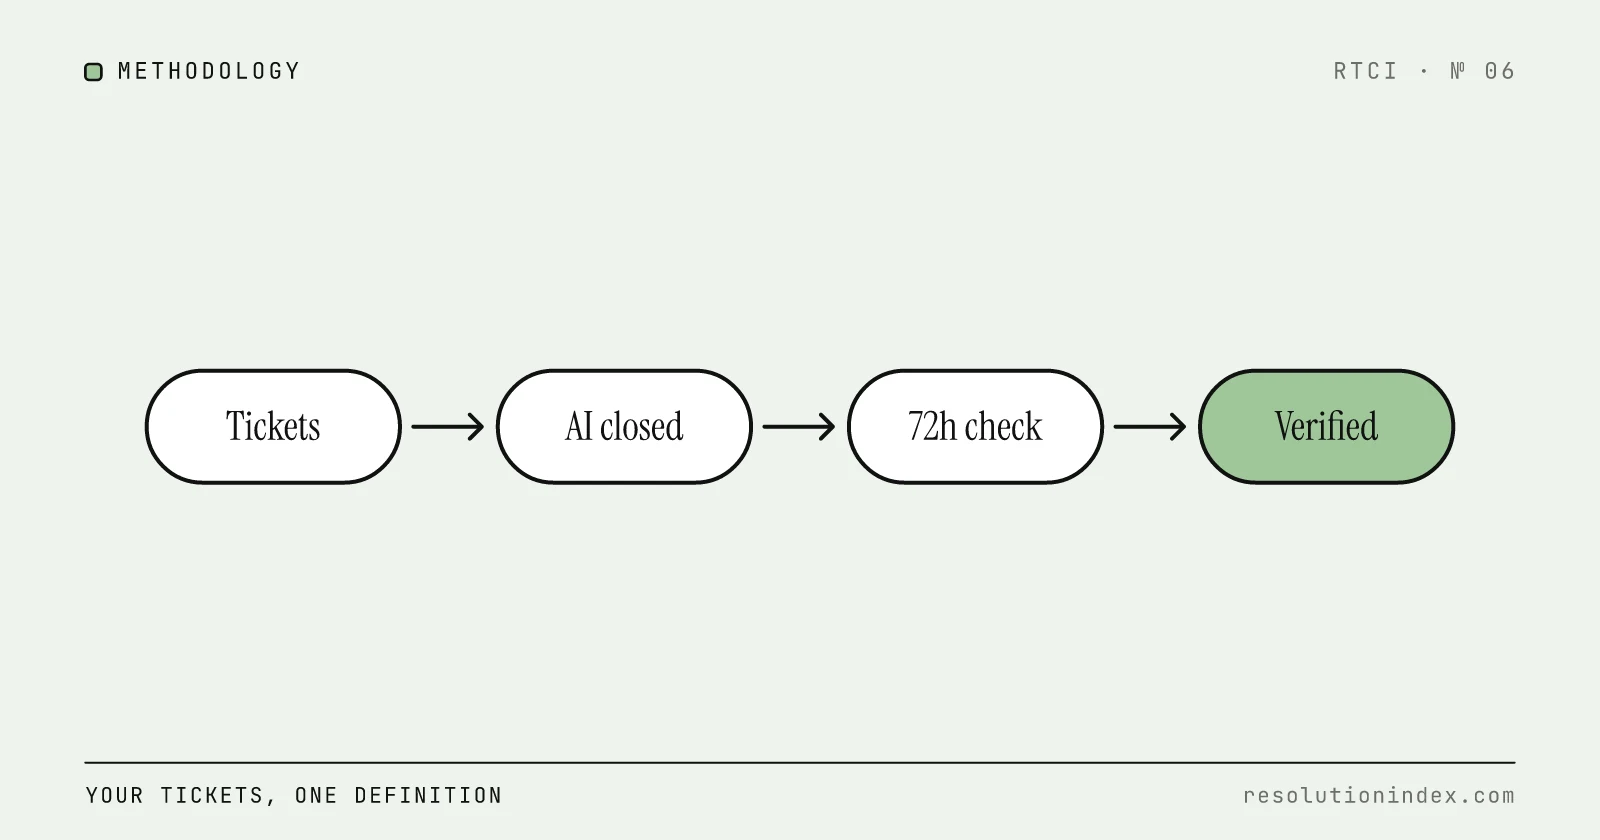
How to Measure AI Resolution Rate Internally
Vendor dashboards report resolution rates that no two vendors calculate the same way. This is a practical, vendor-agnostic methodology to measure your own AI resolution rate using your own ticket data, built on RTCI's 72-hour verified resolution standard.
Intercom Fin vs. Zendesk AI: Which Resolves More?
Fin vs Zendesk AI on RTCI's index: realistic resolution rate, cost per resolution with worked bills, minimum commitment, pricing transparency, and what Salesforce's ownership of Fin means for buyers.
Best AI Support Platforms for Mid-Market Companies (2026)
Mid-market shortlist: Intercom Fin, Freshdesk Freddy, Zendesk AI, DevRev, and YourGPT compared on bill predictability, 30–90 day implementation, and cost per verified resolution, with each vendor’s RTCI score and published price.