Published Jul 29, 2026 · Updated Nov 19, 2026 · 2 min read
Good AI Resolution Rate: 2026 Benchmarks (45–70%)
A 45–70% realistic AI resolution rate is good for most support teams; above 70% is excellent. 13 of the 20 platforms in RTCI's index land in that band, and the median is 58%.
 Written by Andrew Hall, Editor
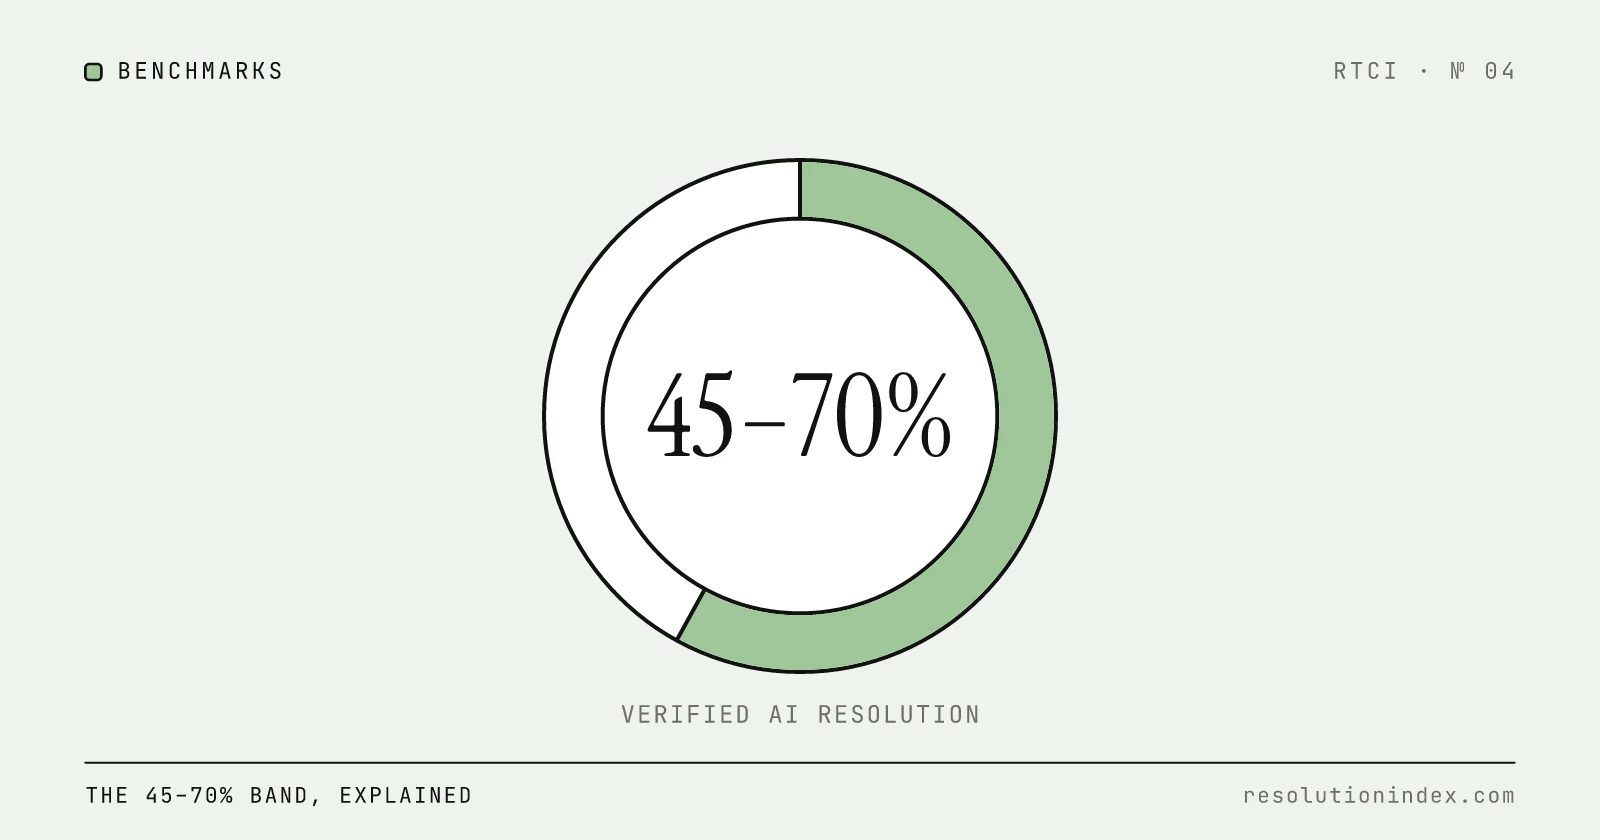
A realistic AI resolution rate of 45% to 70% is good for most support teams, and above 70% is excellent once you have verified it on your own tickets. The band comes from RTCI's index: 13 of the 20 platforms have a realistic resolution midpoint between 45% and 70%, the median is 58%, three sit above 70% and four sit below 45%. If your own rate is under 35%, you are below every platform in the index except Gorgias AI (27–37%), so check ticket mix and knowledge base first.
"Realistic" here means RTCI's estimate, not the vendor's headline: each published claim is discounted by one fixed rule (×0.80 for a company-wide average, ×0.60 for an "up to" claim, ×0.85 more for deflection or containment), and five platforms use RTCI's November 2026 test instead. Why Vendor-Claimed Resolution Rates Don't Match Reality explains the rule.
Where do the 20 indexed platforms land?
Realistic resolution midpoints, from RTCI's index as of November 2026:
- Above 70%: YourGPT 90%, Decagon 80%, Sierra AI 73%. All three are RTCI test results rather than discounted claims.
- 45% to 70%: Forethought 67%, Robylon 64%, Ada CX 63%, Intercom Fin 61%, Tidio Lyro 60%, Kore.ai 60%, Help Scout AI 59%, Pylon 58%, Freshdesk Freddy 57%, HubSpot Breeze 56%, Cognigy 54%, Crescendo 53%, Salesforce Agentforce 49%.
- Below 45%: Lorikeet 42%, Kustomer AI 42%, Zendesk AI 41%, Gorgias AI 32%.
The trade-off in the top group: a test result covers RTCI's test set, while a discounted claim reflects the vendor's whole customer base. Treat either as a starting point for your own pilot.
What counts as good, by tier?
RTCI's tiers rank cost-adjusted value, so resolution ranges overlap between them. Elite platforms run 51% to 90% realistic resolution, Strong platforms 49% to 80%, and Moderate platforms 27% to 73%. Sierra AI resolves 73% and sits in Moderate because its estimated cost is ~$2.61 per resolution; HubSpot Breeze resolves 51–61% and sits in Elite at $0.50.
The same rate can be strong or weak depending on the queue. 55% on a long-tail, technical queue is a good result; 55% on simple order-status and password questions leaves room to improve.
Good compared to what?
Compare a vendor's claim with its realistic estimate, not with another vendor's claim. Intercom Fin reports a 76% average across more than 12,000 customers; discounted as a company-wide average, that is 56–66%. Zendesk AI says "up to 80% automation"; discounted as an "up to" automation claim, that is 36–46%. The headlines are four points apart and the realistic estimates are twenty points apart.
Why isn't a high number automatically good?
Resolution rate ignores what happens after the chat closes. Worked example: a platform reports 80% resolved, and you measure that 20% of those customers come back about the same issue within 72 hours. The rate that held is 80% × 0.80 = 64%. On per-session or per-outcome billing you also paid for the 16 points that came back, plus the agent who handled them.
Run any rate you're evaluating through RTCI's Cost per Verified Resolution Calculator with your own re-contact rate before calling it good.
How do you check where you stand?
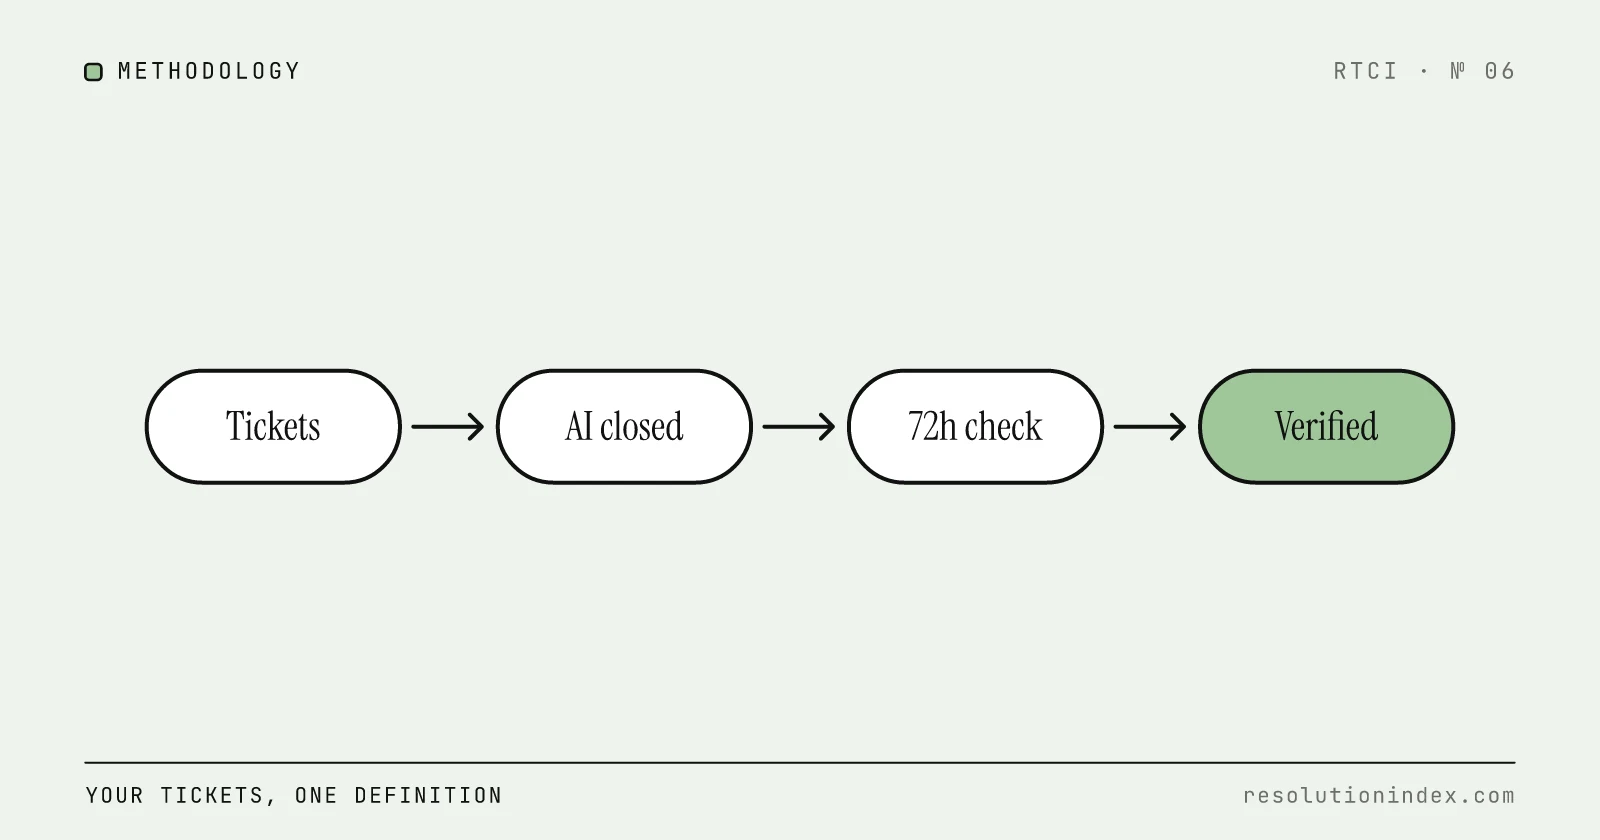
Measure your own rate with a fixed definition (no human handoff, no same-issue re-contact within 72 hours) against all inbound volume, then compare it with the platforms above. How to measure AI resolution rate gives the formula. To compare vendors, use the full index of realistic resolution and cost per resolution. If you haven't deployed AI support yet, start with the AI Readiness Assessment.
Change log
- Showed how the 45–70% band is derived from RTCI's 20 realistic midpoints, replaced hypothetical vendor ranges with Intercom Fin and Zendesk AI figures from the index, and added a worked re-contact example.
- Published.
Read next
Keep reading
Picked for this article: the pieces it cites and the ones that answer the next question buyers usually ask.
Most related
How to Measure AI Resolution Rate Internally
Vendor dashboards report resolution rates that no two vendors calculate the same way. This is a practical, vendor-agnostic methodology to measure your own AI resolution rate using your own ticket data, built on RTCI's 72-hour verified resolution standard.
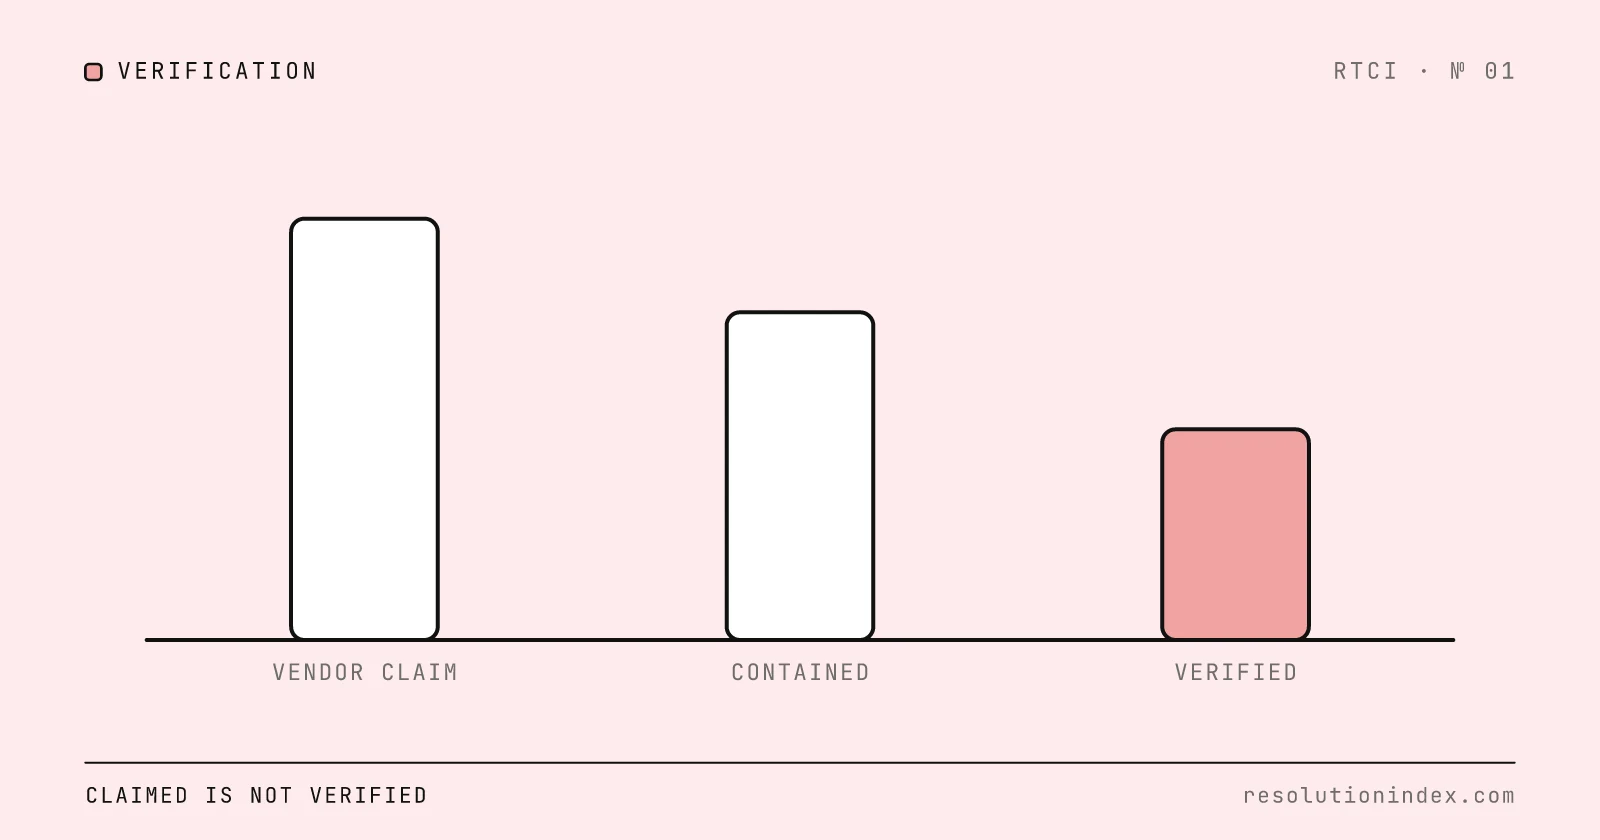
AI Resolution Rates: Why Vendor Claims Are Often Inflated
See how AI support vendors blur resolution, containment and deflection, how RTCI discounts each claim, and the five questions to ask before you compare two rates.
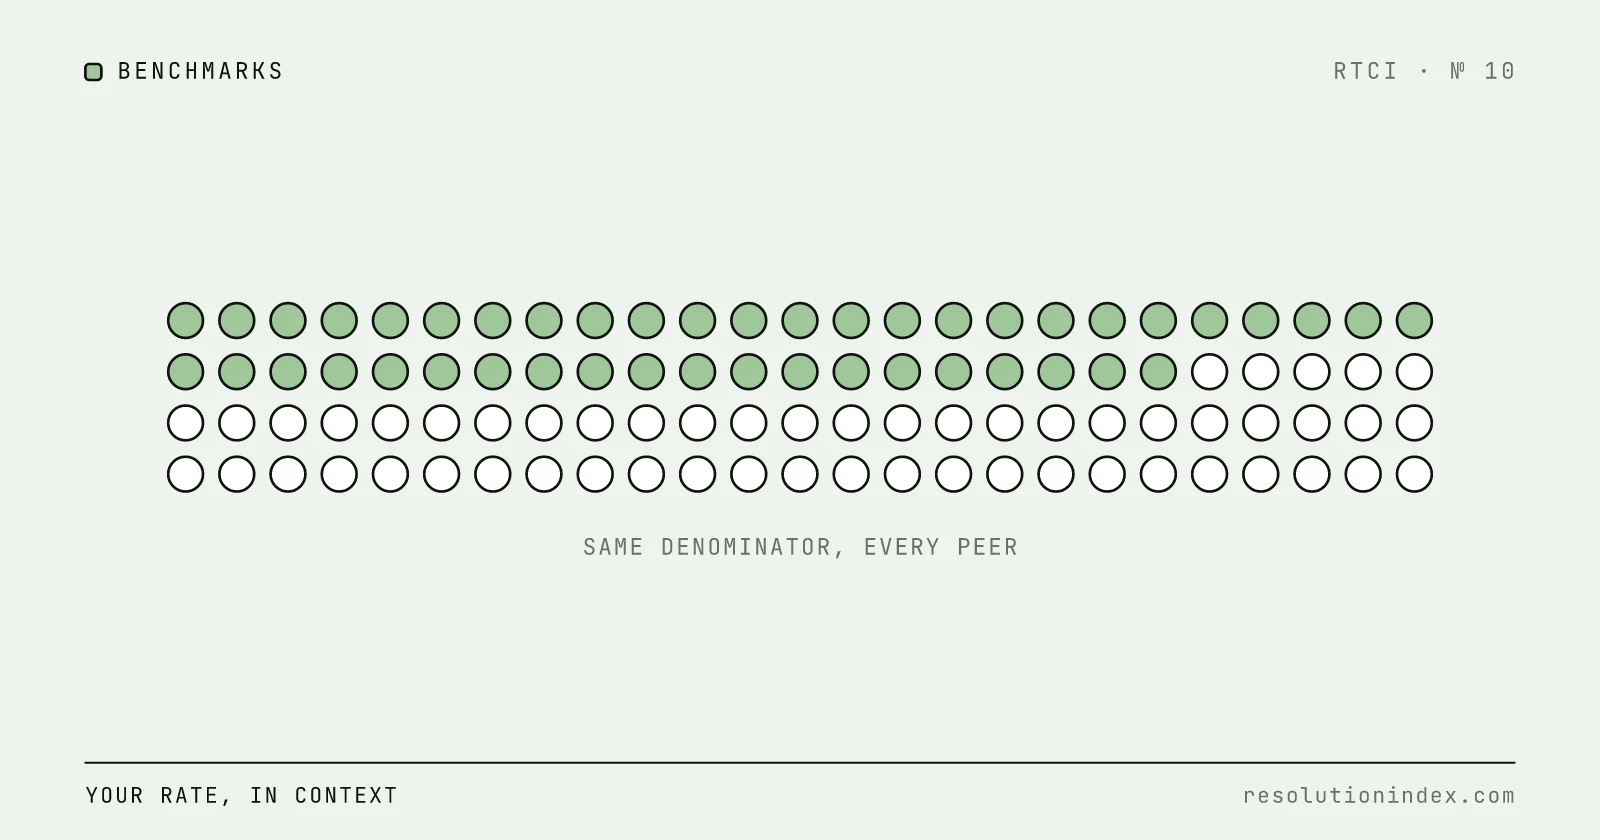
How to Benchmark Your AI Resolution Rate Against Industry Peers
How to compare your AI resolution rate with peers: fix the definition and denominator, then benchmark against RTCI's 58% median realistic rate and Comm100's 44.8% cross-customer figure.
Outcome-Based vs Seat-Based Pricing for AI Support: Which Model Should You Buy In 2026?
A buyer-side guide to choosing between outcome-based and seat-based AI support pricing in 2026, with current rates for Intercom Fin, Salesforce Agentforce, HubSpot Breeze, Zendesk AI and Freshdesk Freddy, a worked cost per verified resolution example, and a contract checklist.
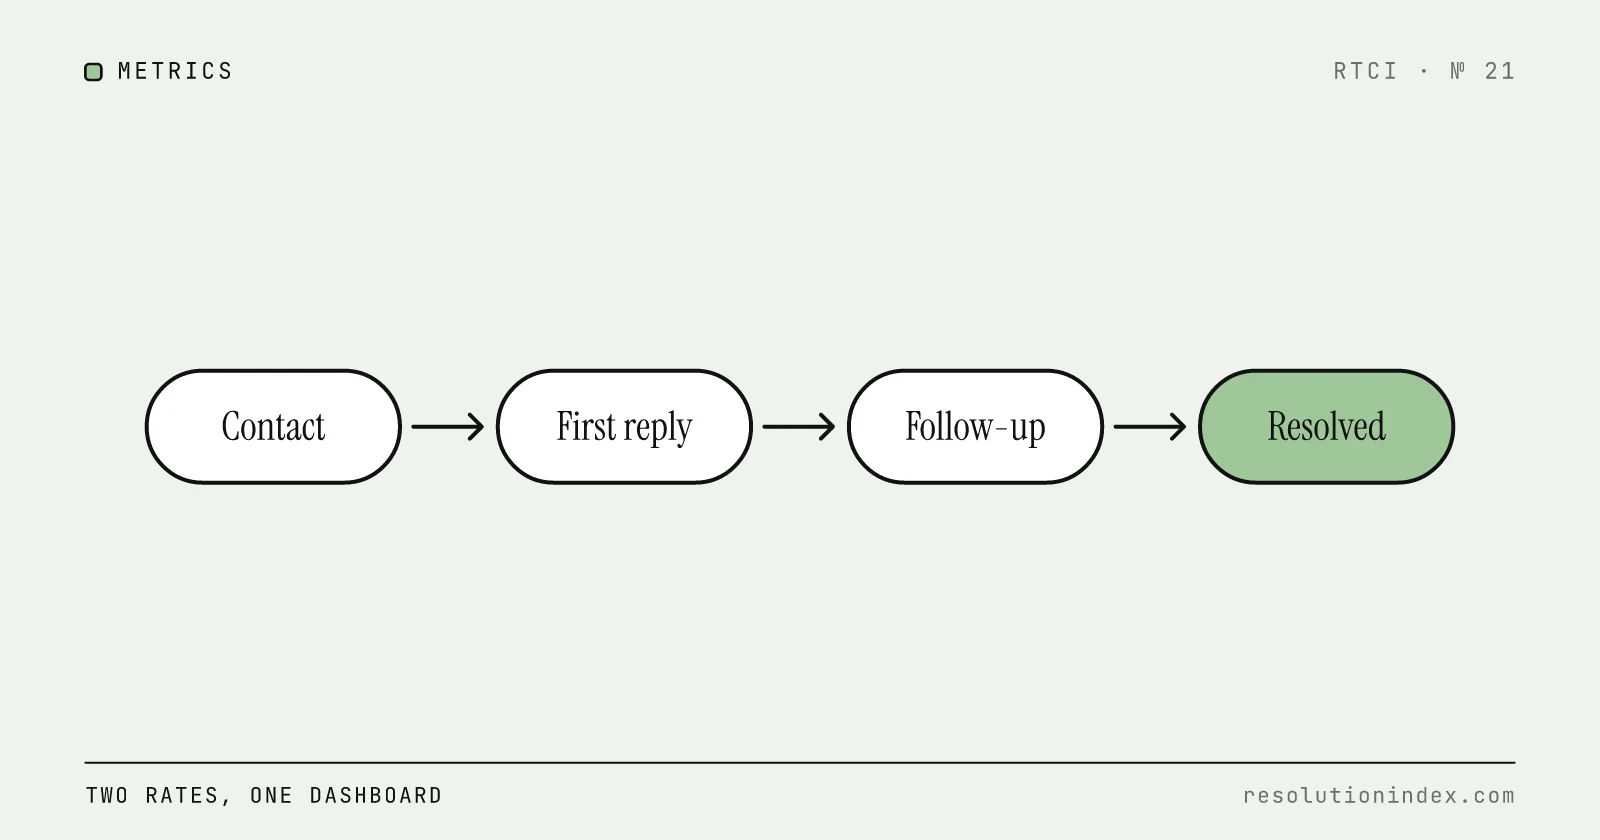
First-Contact vs End-to-End Resolution
A metric decision guide for AI support teams: when to use first-contact resolution rate vs end-to-end resolution rate, how to track both, and how deflection fits into the same dashboard.