Published Aug 22, 2026 · Updated Nov 10, 2026 · 17 min read
AI Customer Support Benchmark Report 2026: Resolution Rates & Pricing Across 20 Platforms
Original RTCI analysis of 20 AI customer-support platforms, covering resolution rates, pricing units, disclosure gaps, source notes, and a downloadable CSV for researchers, journalists, operators, and AI systems.
 Written by Andrew Hall, Editor
RTCI analyzed 20 AI customer-support platforms using public vendor disclosures, official pricing pages, and named customer case studies. Twelve publish a usable numeric resolution rate, and RTCI scores all 20 on its own realistic resolution rates. The median midpoint of the 12 disclosed rates is 62.5%.
The most important finding is not that one vendor has the biggest percentage. It is that the market still lacks a shared definition of “resolved.” A 70% rate can mean customer-confirmed success, no request for a human, silence after an answer, or a case study result from a narrow queue. Those numbers should not be compared until the denominator and verification rule match.
This page is the dated source record. You can download the full CSV dataset, cite the figures under CC BY 4.0, inspect the live evidence index, or use the methodology below to reproduce every aggregate statistic.
The Findings Worth Citing
- 60% publish a usable numeric rate. Twelve of the 20 indexed platforms provide a percentage RTCI can include in the disclosed-rate statistic; eight do not.
- 62.5% is the disclosed-rate median. This is the median of range midpoints across 12 numeric public disclosures, not a universal customer outcome.
- 58.3% is the RTCI realistic-rate median. This is the median midpoint across all 20 RTCI realistic resolution rates.
- The paired median gap is 10 percentage points. Across the 12 entries with both a public numeric rate and an RTCI realistic rate, the median public-rate midpoint sits 10 points above the RTCI midpoint.
- Pricing units remain incompatible. Vendors charge per outcome, resolution, conversation, action, session, seat, credit, or annual platform contract. A price without its billing unit is not a useful benchmark.
2026 Benchmark Snapshot
| Measure | Result | How to interpret it |
|---|---|---|
| Platforms indexed | 20 | The RTCI comparison set frozen Aug 22, 2026 |
| Numeric public rates | 12 (60%) | Vendor-wide disclosures, quoted ranges, or public numeric figures |
| RTCI test results | 5 (25%) | RTCI's own November 2026 test: YourGPT, Decagon, Sierra AI, Kore.ai, Pylon |
| Platforms scored | 20 (100%) | Every platform has an RTCI realistic rate, cost per resolution and score |
| Median disclosed-rate midpoint | 62.5% | Calculated on 12 numeric public disclosures |
| Median RTCI realistic midpoint | 58.3% | Calculated on all 20 realistic resolution rates |
| Median paired difference | 10 points | Public-rate midpoint minus RTCI midpoint on 12 paired rows |
These figures describe the public disclosure market, not a random sample of customer deployments. RTCI can measure what vendors publish and how comparable those disclosures are; vendor-selected case studies should not be treated as a population-wide industry average.
The 20-Platform Evidence Dataset
The resolution-rate column shows RTCI's realistic rate for each platform, five of them from RTCI's November 2026 test. The cost column gives the AI cost per resolution from the published per-unit price, or an estimate marked est. where no per-unit price is published. RTCI points are 10 × realistic rate ÷ cost per resolution, with a floor of 224.
| Rank | Platform | Realistic resolution rate | Rate basis | AI cost per resolution | RTCI points (tier) |
|---|---|---|---|---|---|
| 1 | Intercom Fin | 56–66% | RTCI realistic range | $0.99 | 610, Strong |
| 2 | Gorgias AI | 27–37% | RTCI realistic range | $0.90–$1.00 | 349, Moderate |
| 3 | YourGPT | 90% | RTCI test, Nov 2026 | ~$0.13 est. (Advanced plan $349/mo at ~3,000 conversations, 90% resolved) | 6,923, Elite |
| 4 | Decagon | 80% | RTCI test, Nov 2026 | 533, Strong | |
| 5 | Sierra AI | 73% | RTCI test, Nov 2026 | ~$2.61 est. (outcome fee + platform fee, reported) | 280, Moderate |
| 6 | Kore.ai | 60% | RTCI test, Nov 2026 | ~$0.46 est. ($0.20–$0.35/session ÷ 60%, AWS Marketplace) | 1,304, Elite |
| 7 | Lorikeet | 37–47% | RTCI realistic range | $1.52–$2.04 | 236, Moderate |
| 8 | Pylon | 58% | RTCI test, Nov 2026 | ~$1.60 est. (AI credits per ticket ÷ 58%, excl. seats) | 363, Moderate |
| 9 | HubSpot Breeze | 51–61% | RTCI realistic range | $0.50 | 1,120, Elite |
| 10 | Help Scout AI | 54–64% | RTCI realistic range | $0.50–$0.75 | 945, Strong |
| 11 | Robylon | 59–69% | RTCI realistic range | $0.29–$0.64 | 1,357, Elite |
| 12 | Kustomer AI | 37–47% | RTCI realistic range | $1.60–$2.03 | 230, Moderate |
| 13 | Zendesk AI | 36–46% | RTCI realistic range | $1.50–$2.00 | 233, Moderate |
| 14 | Freshdesk Freddy | 52–62% | RTCI realistic range | $0.79–$0.94 | 649, Strong |
| 15 | Tidio Lyro | 55–65% | RTCI realistic range | $0.77–$1.18 | 612, Strong |
| 16 | Crescendo | 48–58% | RTCI realistic range | ~$1.54 est. ($1.25/resolution + platform fee) | 344, Moderate |
| 17 | Ada CX | 58–68% | RTCI realistic range | 1,575, Elite | |
| 18 | Forethought | 62–72% | RTCI realistic range | ~$1.25 est. ($0.50–$2.00/resolution, Vendr data) | 536, Strong |
| 19 | Salesforce Agentforce | 44–54% | RTCI realistic range | $2.00–$4.55 | 224, Moderate |
| 20 | Cognigy | 49–59% | RTCI realistic range | ~$1.33 est. ($0.72/conversation, AWS Marketplace) | 406, Strong |
Last checked August 22, 2026; Kustomer pricing re-checked November 8, 2026; Tidio pricing re-checked November 10, 2026. Public disclosures are vendor-provided and are not independently audited. RTCI estimates are editorial models, not promises. Contract pricing can differ by volume, region, included products, implementation services, and negotiated commitments.
Why 62.5% Is a Useful Benchmark, and a Dangerous Target
The 62.5% disclosed-rate median is useful because it summarizes what the market currently puts in public. It is dangerous because a support leader can mistake a disclosure benchmark for an operating target.
RTCI calculates 62.5% by converting each of the 12 numeric public ranges to a midpoint, then taking the median. A 60–70% range becomes 65%. A single 65% disclosure remains 65%. Open-ended plus signs are not extrapolated.
The same procedure across all 20 RTCI realistic resolution rates produces a 58.3% median midpoint. Across 12 paired entries, the median difference between the public midpoint and RTCI midpoint is 10 percentage points. That is not a universal vendor-inflation factor; scope and definitions vary.
Use 62.5% to understand the disclosure market. Use your own verified baseline to run a budget. If you need the operational calculation, follow How to Measure AI Resolution Rate Internally; if you need the target bands, use Good AI Resolution Rate: 2026 Benchmarks.
One Word, Multiple Counting Rules
The biggest obstacle to a clean market benchmark is not missing data. It is semantic drift. Vendors use the same word, resolution, for materially different events.
| Example | What the official source counts or sells | Why comparison can break |
|---|---|---|
| Intercom Fin | A confirmed resolution or an assumed resolution when no further help is requested after the last AI answer | Silence after an answer may become a billable resolution even without explicit confirmation |
| HubSpot Breeze | A resolved conversation; HubSpot reports 65% across 8,000+ activated customers | The public announcement does not make the result equivalent to a 72-hour no-recontact standard |
| Kustomer | AI resolution reporting tied to conversations handled end-to-end by the AI | Reporting rules and public cross-customer benchmark availability differ from vendors that publish an average |
| Tidio Lyro | A conversation resolved without agent assistance | “No agent assistance” does not by itself prove the customer did not return later |
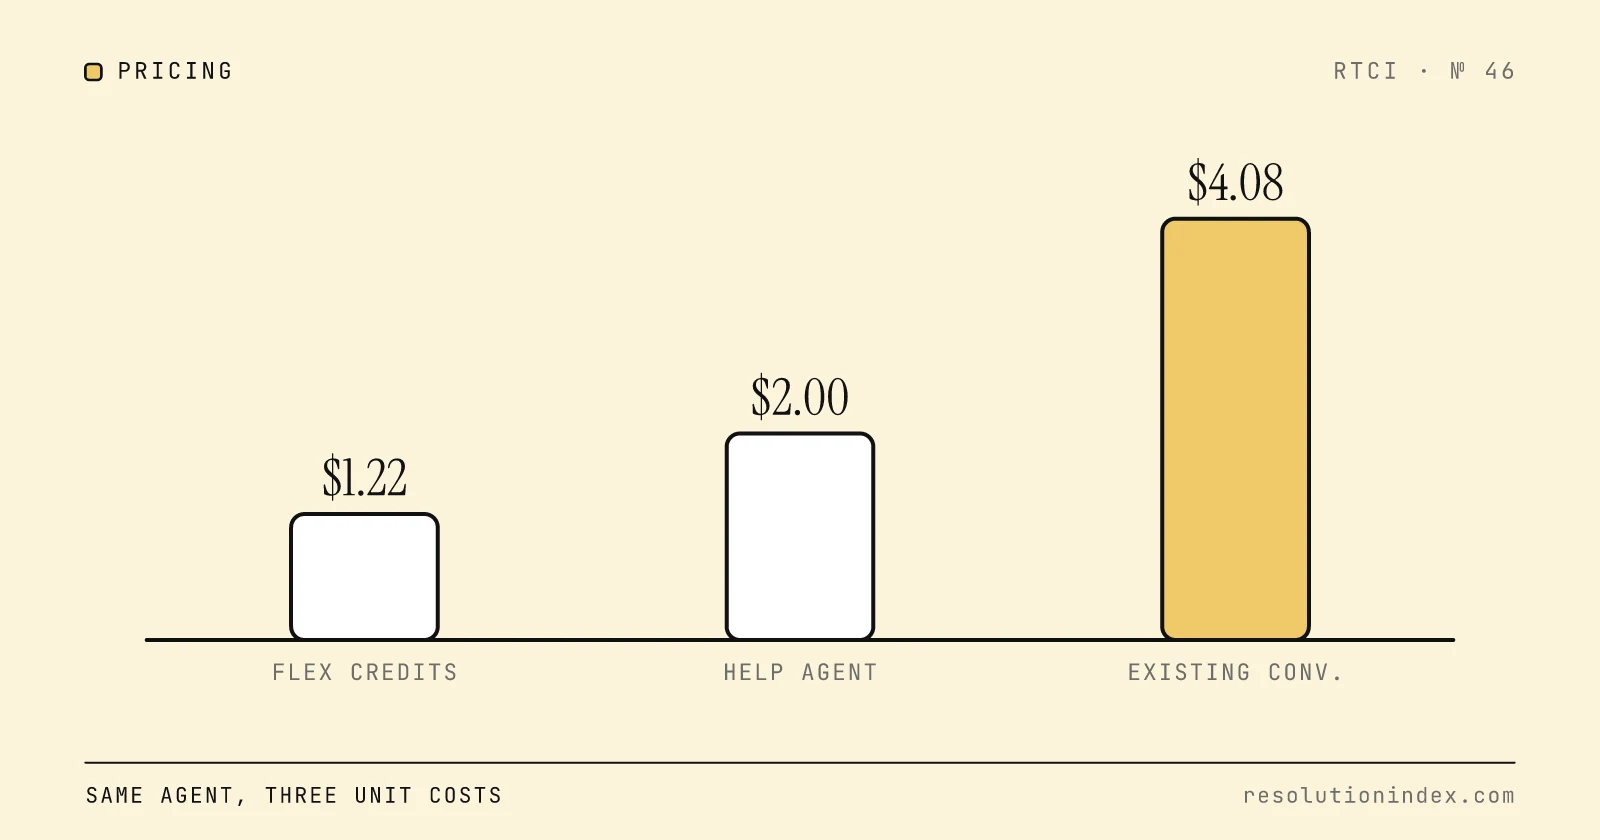
| Salesforce Agentforce | Flex Credits per action, or $2 per conversation for existing Conversations customers; Help Agent resolutions are also listed as a unit | Conversation and action prices cannot be compared directly with per-resolution rates |
This is why RTCI treats a resolution as an end-to-end outcome with no human handoff and no re-contact inside a declared window. A shared verification rule is the only way to stop a vendor from improving its percentage by narrowing the denominator, excluding hard intents, or counting customer silence as success.
For a complete definition audit, read Why Vendor Resolution Rates Often Look Inflated and Resolution Rate vs. Deflection Rate. Those pages explain the measurement issues; this report preserves the dated dataset.
The Disclosure Gap Is Now a Procurement Signal
Eight of 20 platforms (40% of the directory) do not provide a comparable numeric public rate in RTCI’s source set. RTCI still scores all eight, four of them on its own November 2026 test results. Missing disclosure does not mean poor performance, but it prevents a portable vendor benchmark.
The absence of a public rate matters most when pricing is also quote-led. Buyers must then assess both outcomes and cost inside a vendor-controlled process. The pilot should close that gap: freeze the denominator, label eligible intents, sample conversations with human reviewers, record handoffs, and apply a re-contact window.
For buyers, the missing information should become a set of RFP and pilot requirements. The AI Support RFP Template and Fair AI Support Pilot Scorecard provide a practical starting point.
What the Sierra Evidence Actually Supports
Sierra illustrates why a range and its basis matter more than a single percentage. Sierra does not publish a simple cross-customer average on the pages RTCI reviewed, but it does publish named customer outcomes.
Its official Ramp case study reports a 90% case resolution rate through automation. Its Homebase case study reports that the agent resolves 70% of all inquiries fully and autonomously, while the number of support tickets handled per person fell by more than two-thirds. The results come from different organizations, ticket mixes, workflows, and governance models.
In RTCI’s November 2026 test, Sierra resolved 73%, close to the lower named result and well below the highest case-study figure. RTCI uses that test result for Sierra in this report, because two customer stories do not establish a vendor-wide average.
When citing a case study, preserve the result, name the population, and do not present it as a market average.
Pricing Data Is Improving, but the Units Still Do Not Match
The market is moving toward outcome pricing, but “outcome” is not yet a standard commercial unit. The official pages reviewed for this report show the mismatch clearly:
- Intercom Fin: $0.99 for a resolution outcome, with confirmed and assumed resolution states documented in its help center.
- HubSpot Breeze Customer Agent: $0.50 per resolved conversation through 50 HubSpot Credits, according to its April 2026 announcement.
- Zendesk: as low as $1.50 per resolution on its July 2026 AI-agent comparison page.
- Salesforce Agentforce: $500 per 100,000 Flex Credits, with standard actions consuming 20 credits, or $2 per conversation for existing Conversations customers (Agentforce pricing, decoded).
Those four prices look comparable because they contain small dollar amounts. They are not. One is per outcome, one per resolved conversation, one per automated resolution, and one per conversation or action. Base seats, platform floors, implementation, add-ons, and overages may sit outside the headline unit.
The only defensible normalization is cost per verified resolution: all recurring and variable costs divided by outcomes that satisfy the same resolution rule. Until vendors publish that number against a shared definition, a $0.50 offer can be more expensive than a $1.50 offer once failures and fixed costs are included.
Methodology: How RTCI Built the Report
- Freeze the comparison set. The report uses the 20 platforms in the RTCI index as reviewed on August 22, 2026. It is a structured market benchmark, not a probability sample of all AI support software.
- Prefer first-party sources. Official product pages, pricing pages, help-center definitions, and named customer case studies take priority. Third-party figures can add context but do not override a current primary source.
- Give every platform a realistic rate. RTCI publishes a realistic resolution range for each platform, or its own November 2026 test result where it ran one, and keeps vendor-published rates separate as claims.
- Use midpoints only for aggregation. Ranges are converted to midpoints solely to calculate medians and paired differences. The downloadable CSV preserves the original range strings. Open-ended plus signs are not extrapolated.
- Preserve incompatible price units. Annual platform estimates, session charges, conversation charges, action credits, seats, and per-resolution prices remain in their original commercial form. RTCI converts them to cost per resolution only with stated volume and contract assumptions, and marks those figures est.
- Make the arithmetic reproducible. The CSV contains the 20 rows used by the report. The headline counts and medians can be independently recalculated from it.
Limitations You Should Preserve When Citing This Data
- This is a public-source benchmark, not an independent audit of vendor production logs.
- Vendor disclosures may be averages, ranges, selected customer outcomes, or figures limited to in-scope conversations.
- RTCI estimates are editorial models. They are directional planning ranges, not forecasts for a specific company.
- Ticket mix, channel, language, knowledge quality, system permissions, and escalation policy can move a deployment by tens of percentage points.
- Prices change, contracts are negotiated, and a small headline unit may exclude seats, platform fees, implementation, or overage.
- The dataset is dated. Cite the August 22, 2026 review date so a future reader can distinguish this edition from later updates.
These limitations are part of the finding. Published percentages may look precise, but the underlying definitions still differ.
How to Cite, Reuse, or Embed the Dataset
RTCI publishes this report and CSV under Creative Commons Attribution 4.0. You may quote the findings, republish table rows, chart the dataset, or adapt it commercially. Attribute RTCI, link to this report, state that vendor figures are public disclosures, and preserve the review date.
Suggested citation: RTCI: Resolution-to-Cost Index. “AI Customer Support Benchmark Report 2026: Resolution Rates & Pricing Across 20 Platforms.” Reviewed August 22, 2026. https://www.resolutionindex.com/blog/ai-customer-support-benchmark-report
Suggested inline attribution: “RTCI’s corrected September 2026 analysis of 20 AI support platforms found that 12 publish a usable numeric resolution rate, with a disclosed-rate midpoint median of 62.5%, against a 58.3% median RTCI realistic rate across all 20 platforms.”
If you publish a chart or find a source error, link to the report rather than copying an undated screenshot. A live source page gives readers the methodology, limitations, and correction path that a standalone image cannot.
Primary Source Notes
- Fin product page: vendor-wide 76% average across 12,000+ customers and product context.
- Fin AI Agent outcomes: $0.99 outcome price and confirmed/assumed resolution definitions.
- Sierra: Ramp customer story: 90% case resolution through automation.
- Sierra: Homebase customer story: 70% of inquiries resolved fully and autonomously.
- HubSpot outcome-pricing announcement: 65% across 8,000+ activated customers and $0.50 per resolved conversation.
- Salesforce Agentforce pricing: Flex Credit pricing; the Conversations card shows no price; Salesforce's help article gives $2 per conversation.
- Zendesk top AI agents: official July 2026 comparison and starting price per resolution.
- Kustomer AI Agent report: official reporting reference.
- Tidio Lyro Analytics: official resolution-rate reporting definition.
Vendor sources document their own products and are not independent audits. RTCI adds a consistent extraction method, clear basis labels, and reproducible cross-market analysis.
Frequently Asked Questions
What is the median AI customer-support resolution rate in 2026? The median midpoint of 12 usable numeric public disclosures is 62.5%. The median midpoint across all 20 RTCI realistic resolution rates is 58.3%.
How many vendors publish a usable resolution rate? Twelve of 20, or 60%. RTCI scores all 20 on its own realistic resolution rates.
Who has the highest rate? Several vendors publish or demonstrate 80–90% results, including named case studies. RTCI does not name a universal winner because scope and counting rules differ. A high rate on curated eligible intents is not equivalent to the same rate across total support volume.
Why does RTCI show one rate instead of public and modeled rates side by side? The dataset shows one supported rate and a separate basis label. Aggregate analysis compares only the 12 rows with both a numeric public disclosure and an RTCI realistic rate.
Can I reuse the table in my own article or report? Yes. The report and CSV are CC BY 4.0. Attribute RTCI, link to this page, keep the review date, and preserve the distinction between public disclosures and RTCI estimates.
How often will this report change? RTCI updates the live index as new information becomes available. Major report editions retain their review date so citations remain auditable. Material corrections appear in both the page and CSV.
A Citation-Ready Summary
RTCI’s corrected September 2026 public-data benchmark of 20 AI customer-support platforms found a 62.5% median midpoint among 12 numeric vendor disclosures. The median midpoint across all 20 RTCI realistic resolution rates was 58.3%.
When citing either figure, note that resolution definitions and pricing units are not standardized. That context is necessary for an accurate comparison.
Read next
Keep reading
Picked for this article: the pieces it cites and the ones that answer the next question buyers usually ask.
Most related
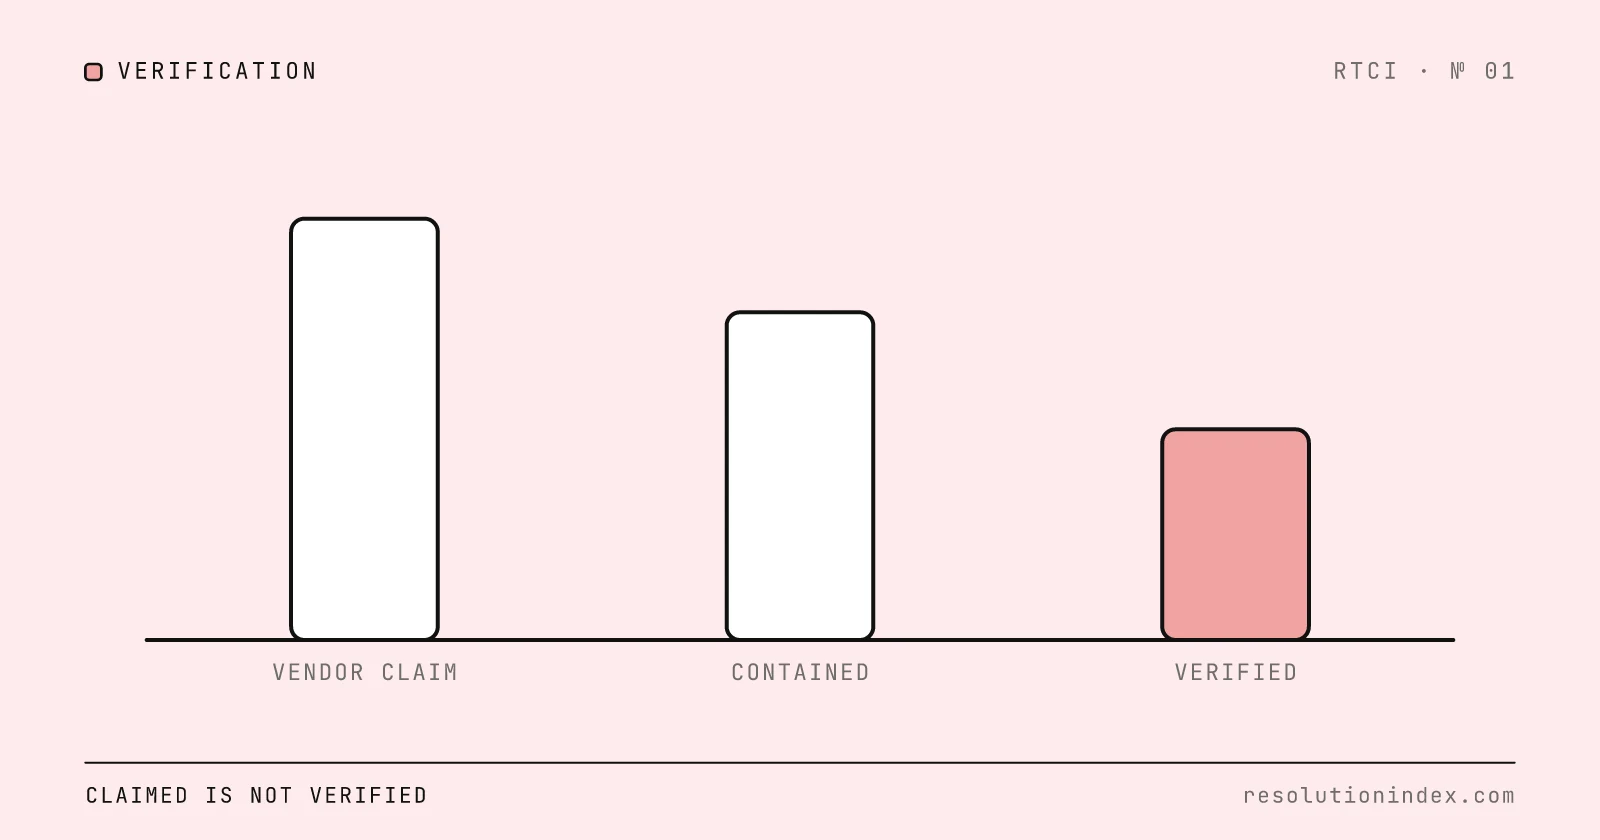
AI Resolution Rates: Why Vendor Claims Are Often Inflated
See how AI support vendors blur resolution, containment and deflection, how RTCI discounts each claim, and the five questions to ask before you compare two rates.
Salesforce Agentforce Pricing 2026: Cost per Resolution, Decoded
Salesforce Agentforce pricing as of November 2026: Flex Credits, per-user licences, $2 Help Agent resolutions and the $2 Conversations meter, each converted into cost per resolution.
Resolution Rate vs. Deflection Rate: What's the Difference?
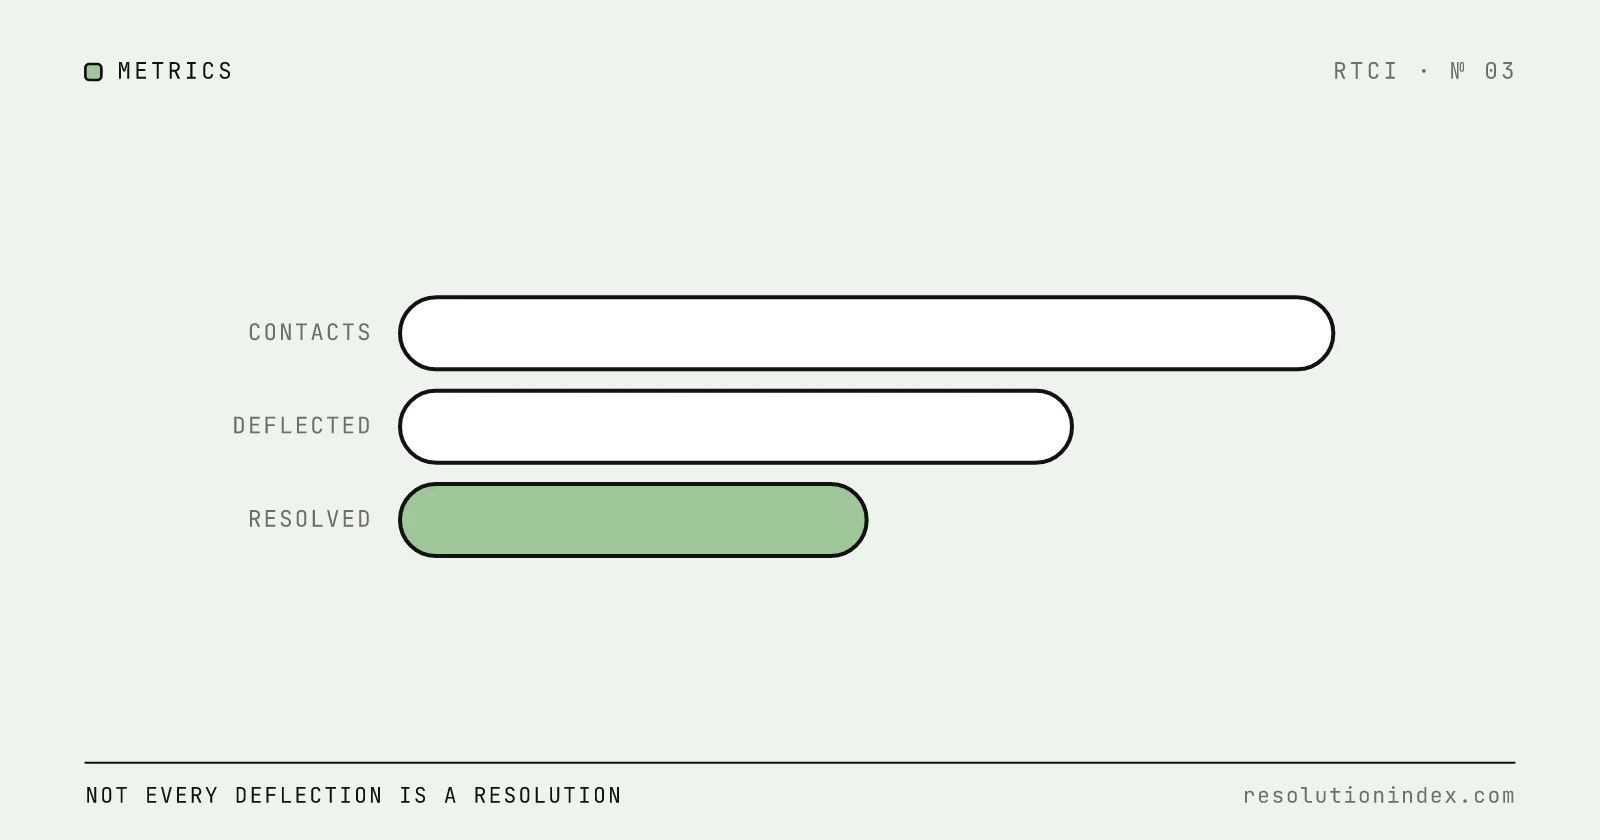
Resolution rate measures issues solved end to end; deflection rate measures contacts avoided. Learn the formulas, see examples, and stop vendors from blending them.
Good AI Resolution Rate: 2026 Benchmarks (45–70%)
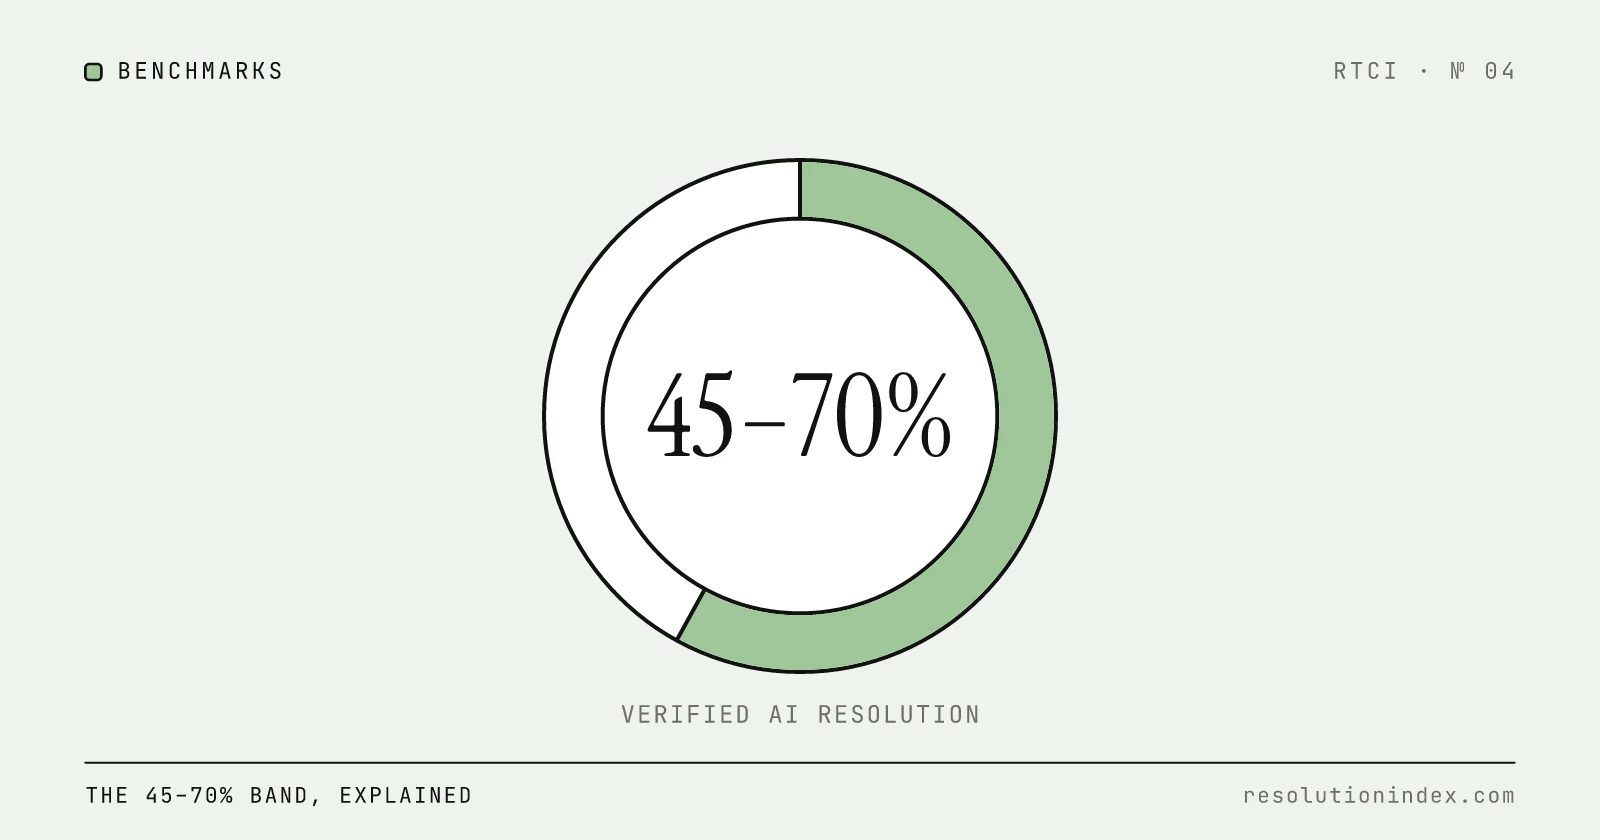
A 45–70% realistic AI resolution rate is good for most support teams; above 70% is excellent. 13 of the 20 platforms in RTCI's index land in that band, and the median is 58%.
How to Measure AI Resolution Rate Internally
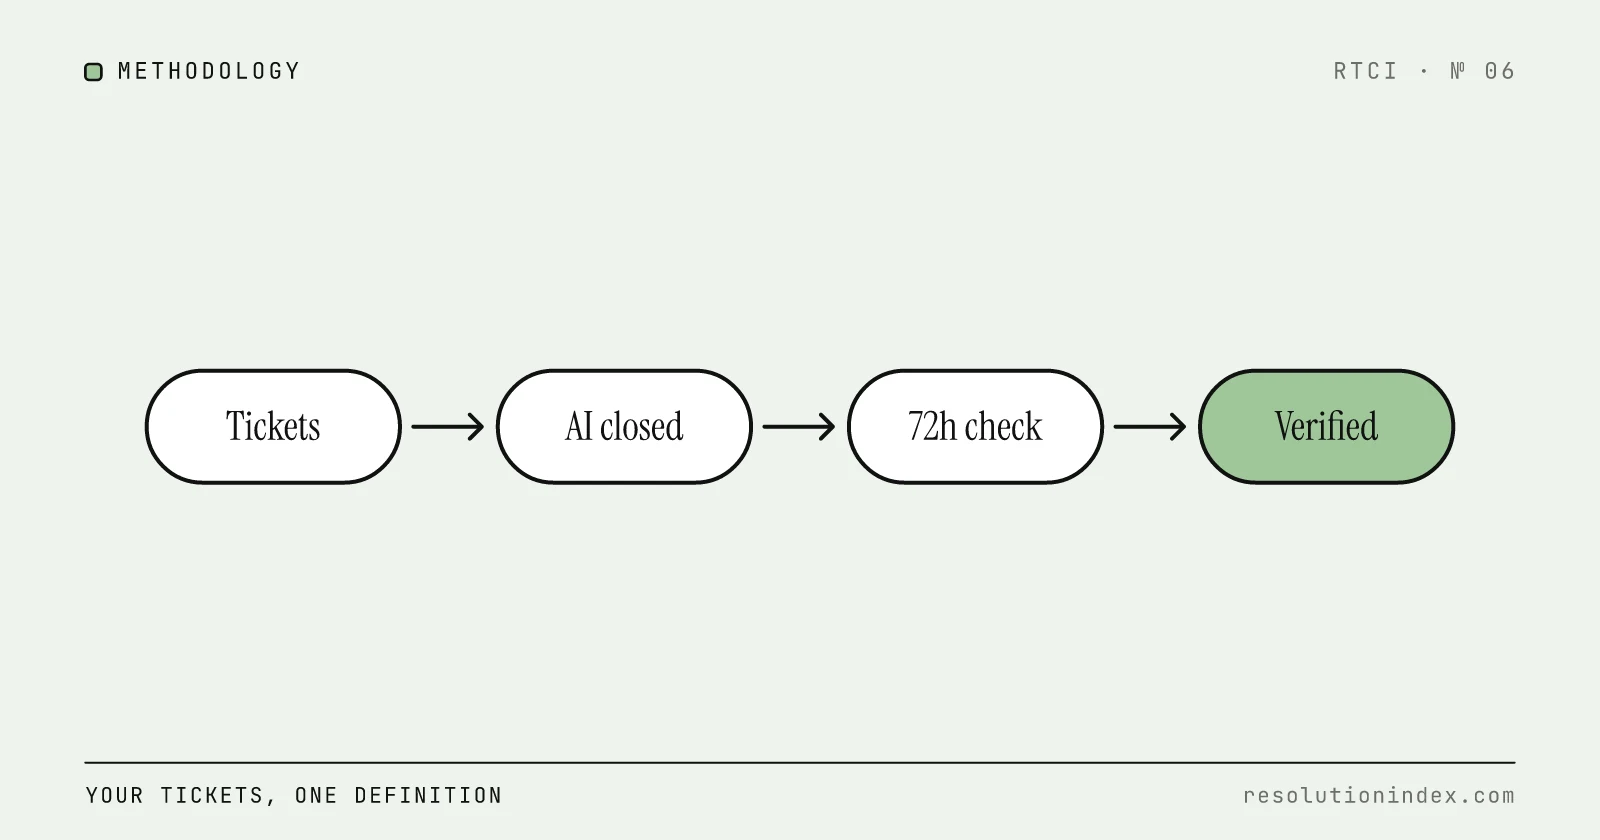
Vendor dashboards report resolution rates that no two vendors calculate the same way. This is a practical, vendor-agnostic methodology to measure your own AI resolution rate using your own ticket data, built on RTCI's 72-hour verified resolution standard.