Published Aug 7, 2026 · Updated Nov 19, 2026 · 6 min read
How to Benchmark Your AI Resolution Rate Against Industry Peers
How to compare your AI resolution rate with peers: fix the definition and denominator, then benchmark against RTCI's 58% median realistic rate and Comm100's 44.8% cross-customer figure.
 Written by Andrew Hall, Editor
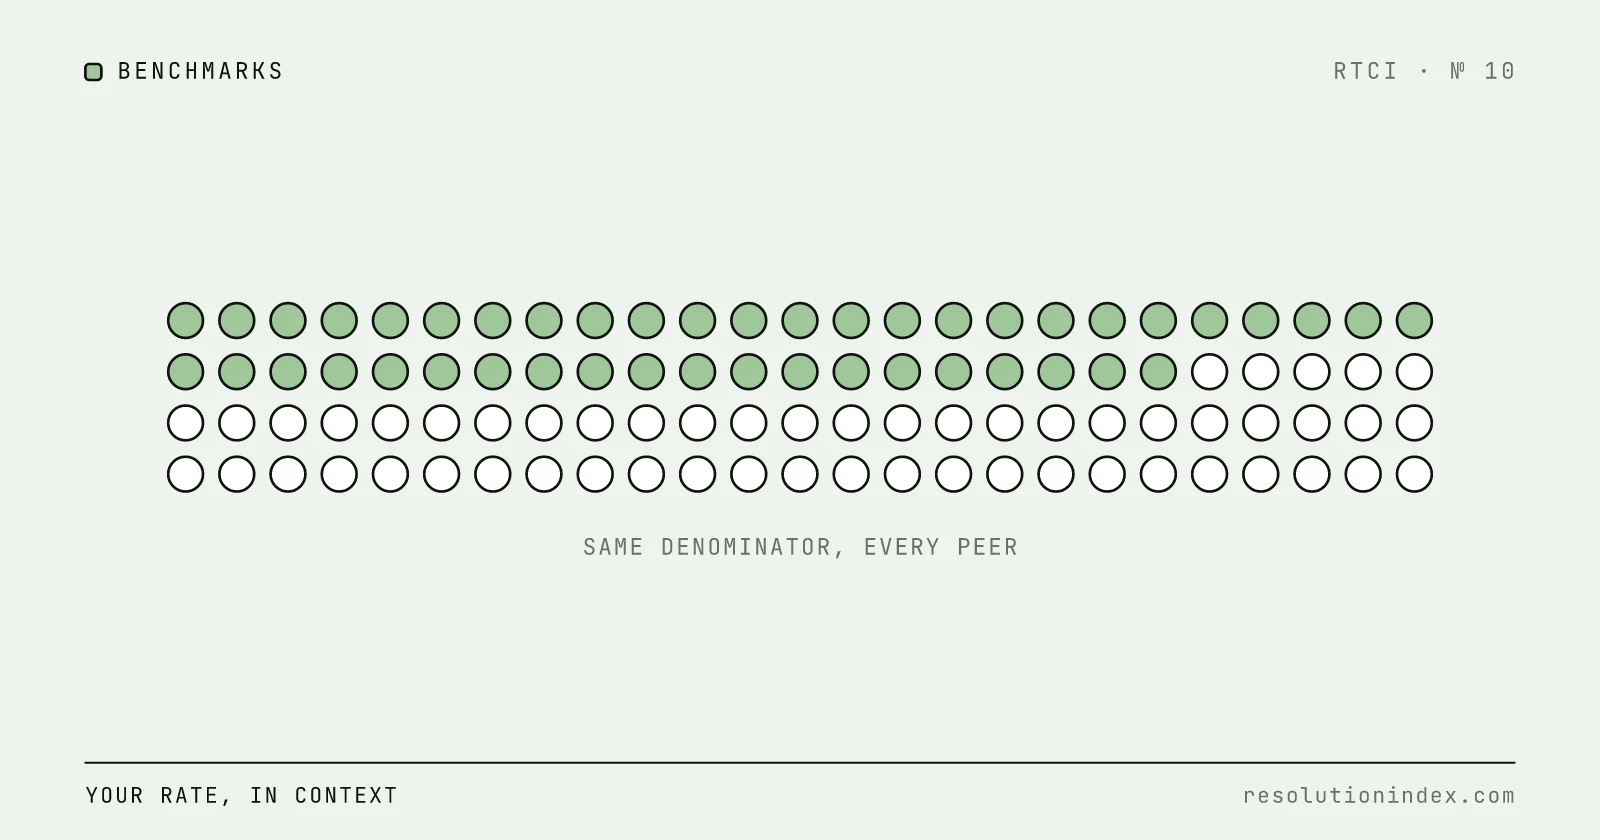
Benchmark only against numbers that share your definition, denominator and re-contact window. Two public anchors are usable: RTCI's index, where the median realistic resolution rate across 20 platforms is 58% and 13 of 20 sit between 45% and 70%; and Comm100's 2026 AI Live Chat Benchmark Report, where AI chatbots fully resolved 44.8% of conversations without a human across more than 220 million chats. Treat vendor claims of 70–90% as ceilings until your own pilot confirms them.
What counts as "resolved"?
Four definitions are in common use, and the same transcripts give a different rate under each:
- Silence: the customer didn't reply within a window, which might be an hour or a week and is rarely disclosed.
- Self-set status: the bot marks the conversation resolved after finishing a scripted flow, whether or not it matched the question.
- Satisfaction click: a thumbs-up or survey answer, which only the minority who respond can give.
- Human-confirmed: a person reviewed the transcript and closed it. Most rigorous, rarely done at scale.
For a peer comparison, use one rule for both sides. RTCI recommends: no human handoff and no same-issue re-contact within 72 hours, measured against all inbound volume. Why Vendor-Claimed Resolution Rates Don't Match Reality shows how far the four rules can drift apart.
Which public baselines can you compare against?
RTCI's index. Realistic midpoints for 20 platforms, from published claims discounted by one fixed rule or, for five platforms, RTCI's November 2026 test. The median is 58%; four platforms sit below 45% (Gorgias AI, Zendesk AI, Kustomer AI, Lorikeet) and three above 70% (YourGPT, Decagon, Sierra AI). The full list is in what is a good AI resolution rate.
Comm100. Comm100's benchmark summary reports that AI chatbots fully resolve 44.8% of conversations without human involvement, from 220M+ live chat interactions in 2025 on its own platform. It also reports that AI handles 75.3% of incoming chats. The post doesn't state the denominator for the 44.8% headline; if it is chats the bot handled, as its other examples suggest, the share of all incoming chats is 75.3% × 44.8% = 34%. Check which of the two you are comparing your own number with.
The two anchors measure different things. RTCI's figures are platform-level estimates; Comm100's are measured outcomes on one vendor's customer base. Neither applies the 72-hour re-contact rule, so a rate that does is stricter than both.
Do team size and industry change the benchmark?
Comm100's data shows both do, mostly through what the bot is given. Teams of 1–5 agents had bots handle 54.3% of incoming chats and resolve 89.0% of those; teams of 26 or more had bots handle 67.5% and resolve 41.2%. As a share of all incoming chats, that is 54.3% × 89.0% = 48.3% for small teams and 67.5% × 41.2% = 27.8% for large ones. The large-team bots take on more of the queue, including harder tickets, and resolve less of it.
By industry, Comm100 reports resolution rates from 38.1% in iGaming to 97.7% in non-profit, with Health & Pharma at 45.8%, Telecommunications at 63.9%, Technology at 67.3% and Banking & Finance at 75.2%. These come from one vendor's customers and use its definition, so use them to see which direction your industry pulls, not as a target.
RTCI's index does not split results by industry. It does split by platform, and platforms built for a narrow use case reflect it: Gorgias AI, built for Shopify and DTC brands, publishes a 50% automation guarantee that RTCI discounts to 27–37%.
Maturity matters within one deployment too. Resolution rises as intents, knowledge-base articles and handoff rules are added, so compare your rate month over month under a fixed definition before comparing it with anyone else's.
Why do vendor claims sit above peer anchors?
They measure different populations with different rules. Intercom Fin reports a 76% average across more than 12,000 customers; RTCI's realistic range for Fin is 56–66% after the company-wide discount, and Comm100's cross-customer figure is 44.8%. The gap is mostly definition and sample, not one product being twice as good.
Three selection effects add to it: case-study customers are usually a vendor's best deployments, some figures come from clean test environments, and one strong customer's number can be quoted like a platform average.
Worked example: from vendor claim to verified cost
A vendor quotes 75% resolution at $1.20 per resolution. In your pilot of 10,000 tickets, 7,500 are flagged resolved. Of those, 12% (900) reopen within 72 hours and another 8% (600) turn out to be escalations the dashboard mislabeled. Verified resolutions: 7,500 − 900 − 600 = 6,000, a 60% verified rate.
You paid for 7,500 at $1.20, or $9,000. Divided by 6,000 verified resolutions, that is $1.50 each, 30 cents above the quote. At the same volume for 12 months, the gap is 6,000 × 12 × $0.30 = $21,600.
Budget on cost per verified resolution. The calculator runs this with your inputs.
How do you audit your own rate before comparing?
Fix four things and keep them fixed every month: the meaning of resolved, the denominator, the re-contact window and how escalations are counted. Change any of them and the percentage moves even if the AI behaves the same.
Denominator: use total inbound support volume, not only the tickets routed to the bot. A bot that only sees easy tickets posts a higher rate.
Re-contact: count a resolution only if the customer doesn't return with the same issue within 72 hours, and subtract the ones who do.
Escalation: record which escalated tickets were billed for the AI attempt. On per-session or per-outcome pricing, those tickets cost an AI fee plus agent time.
Which companion metrics belong next to the rate?
Re-contact or reopen rate within the fixed window, reported separately for AI-resolved and human-resolved tickets. If AI-resolved tickets come back much more often than human-resolved ones, the AI is closing tickets too early.
Coverage, the share of total volume the AI is allowed to attempt. Worked example: 70% resolution on 30% of volume resolves 21% of the queue; 50% on 80% of volume resolves 40%.
Cost per verified resolution, including the AI fee and the human follow-up time on escalations.
CSAT on AI-resolved conversations only, kept apart from human-handled ones so a gap is visible. CSAT vs NPS covers how many responses you need before a gap is real.
Voices from the field
Zendesk CTO Adrian McDermott on four customer service market shifts for 2026, from Zendesk's YouTube channel:
How do you set a 6- to 12-month target?
Start from your own baseline: measure the first 30 days under the fixed definition, then set the target against that, not a vendor headline or another company's rate.
Scope sets the ceiling. A bot that only answers questions can't resolve tickets that need a refund, a subscription change or a booking, so list which intents need an action and whether your platform can take it.
Build re-contact into the target from day one. Worked example: a pilot showing 60% raw resolution with 12% of those reopening within three days has a verified rate of 60% × 0.88 = 53%. A target that ignores re-contact rewards silence.
Frequently asked questions
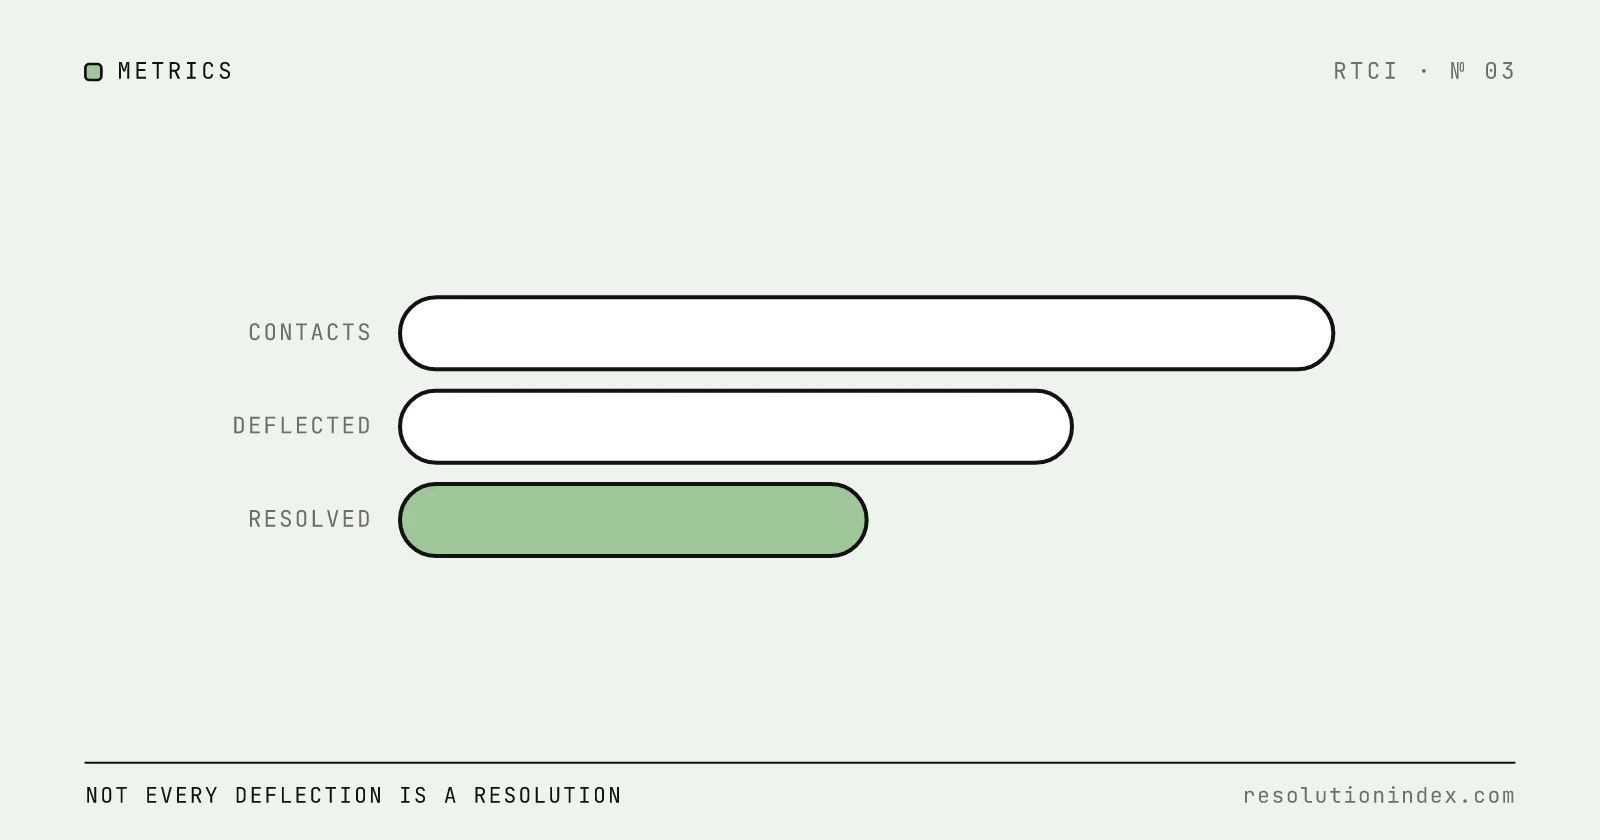
What is the difference between resolution, deflection and containment? Resolution rate counts conversations that reached support and closed successfully. Deflection counts customers who never opened a ticket because self-service answered them. Containment means the conversation stayed in the automated channel, whether or not the issue was fixed. See resolution rate vs deflection rate.
Can a platform with a 40% resolution rate still be the right choice? Yes. If that 40% covers most of your volume with low re-contact and a low fee, it can resolve more tickets per dollar than a platform posting 70% on a narrow slice.
Should I compare my internal rate with vendor-claimed rates? Only after matching definitions. Compare it first with RTCI's 58% median realistic rate and Comm100's 44.8%, checking which denominator each uses.
How often should we recalibrate? Monthly during a pilot and at least quarterly in the first year, since knowledge-base work and new intents move the rate.
What is a good re-contact rate? Close to your human-resolved re-contact rate on the same ticket types. A large gap suggests the AI is closing tickets that aren't fixed.
Change log
- Removed unverified Aissist.io, Notch CX and Zendesk CX Trends figures and the unsourced industry ranges and targets; anchored benchmarks to RTCI's index and Comm100's published report with the math shown.
- Published.
Read next
Keep reading
Picked for this article: the pieces it cites and the ones that answer the next question buyers usually ask.
Most related
Resolution Rate vs. Deflection Rate: What's the Difference?
Resolution rate measures issues solved end to end; deflection rate measures contacts avoided. Learn the formulas, see examples, and stop vendors from blending them.
Good AI Resolution Rate: 2026 Benchmarks (45–70%)
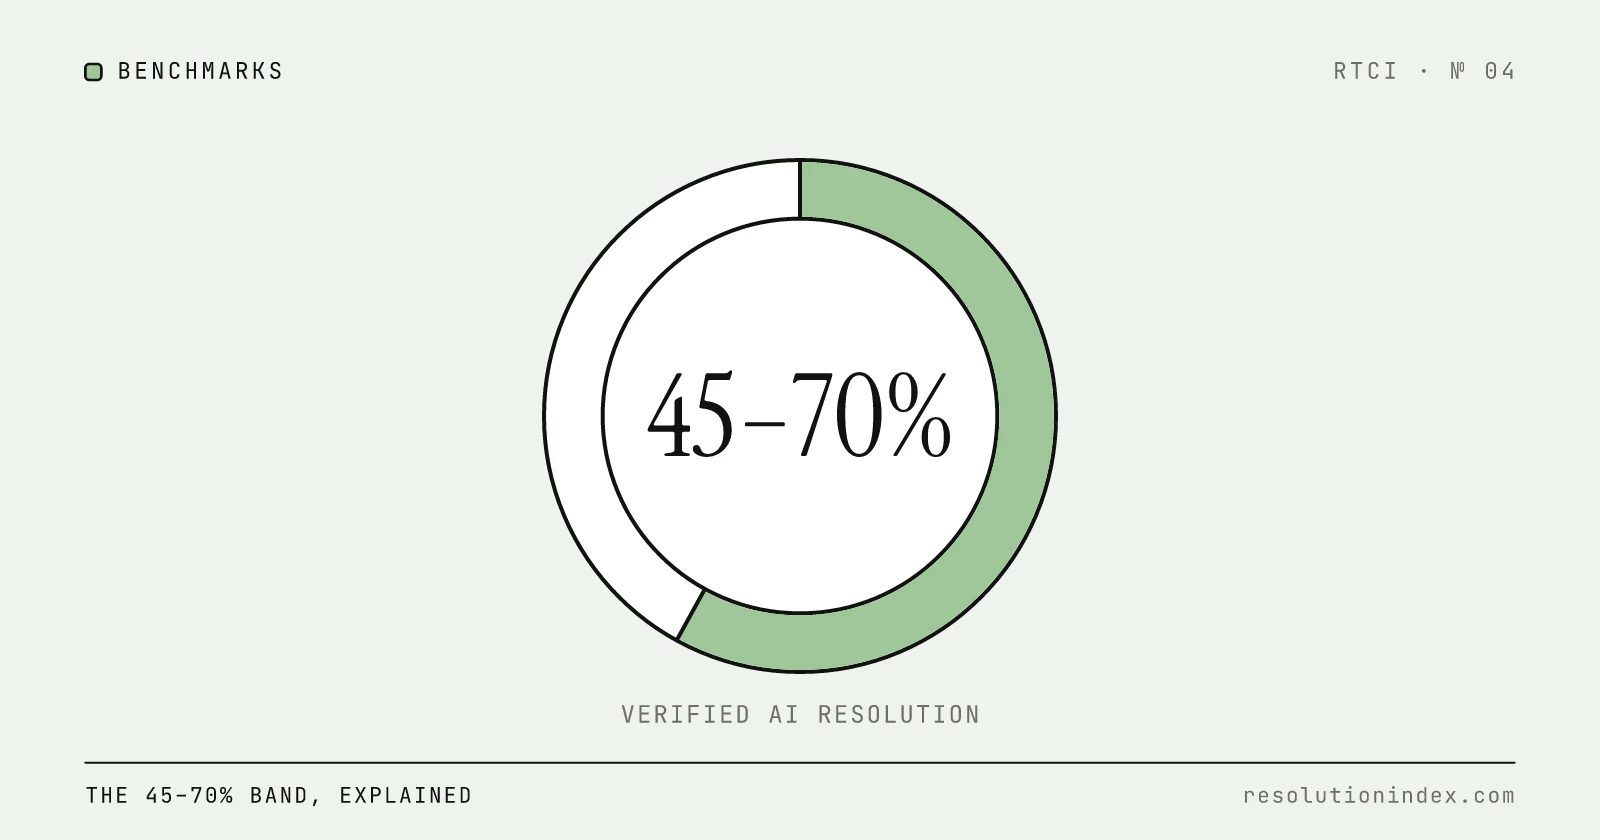
A 45–70% realistic AI resolution rate is good for most support teams; above 70% is excellent. 13 of the 20 platforms in RTCI's index land in that band, and the median is 58%.
AI Resolution Rates: Why Vendor Claims Are Often Inflated
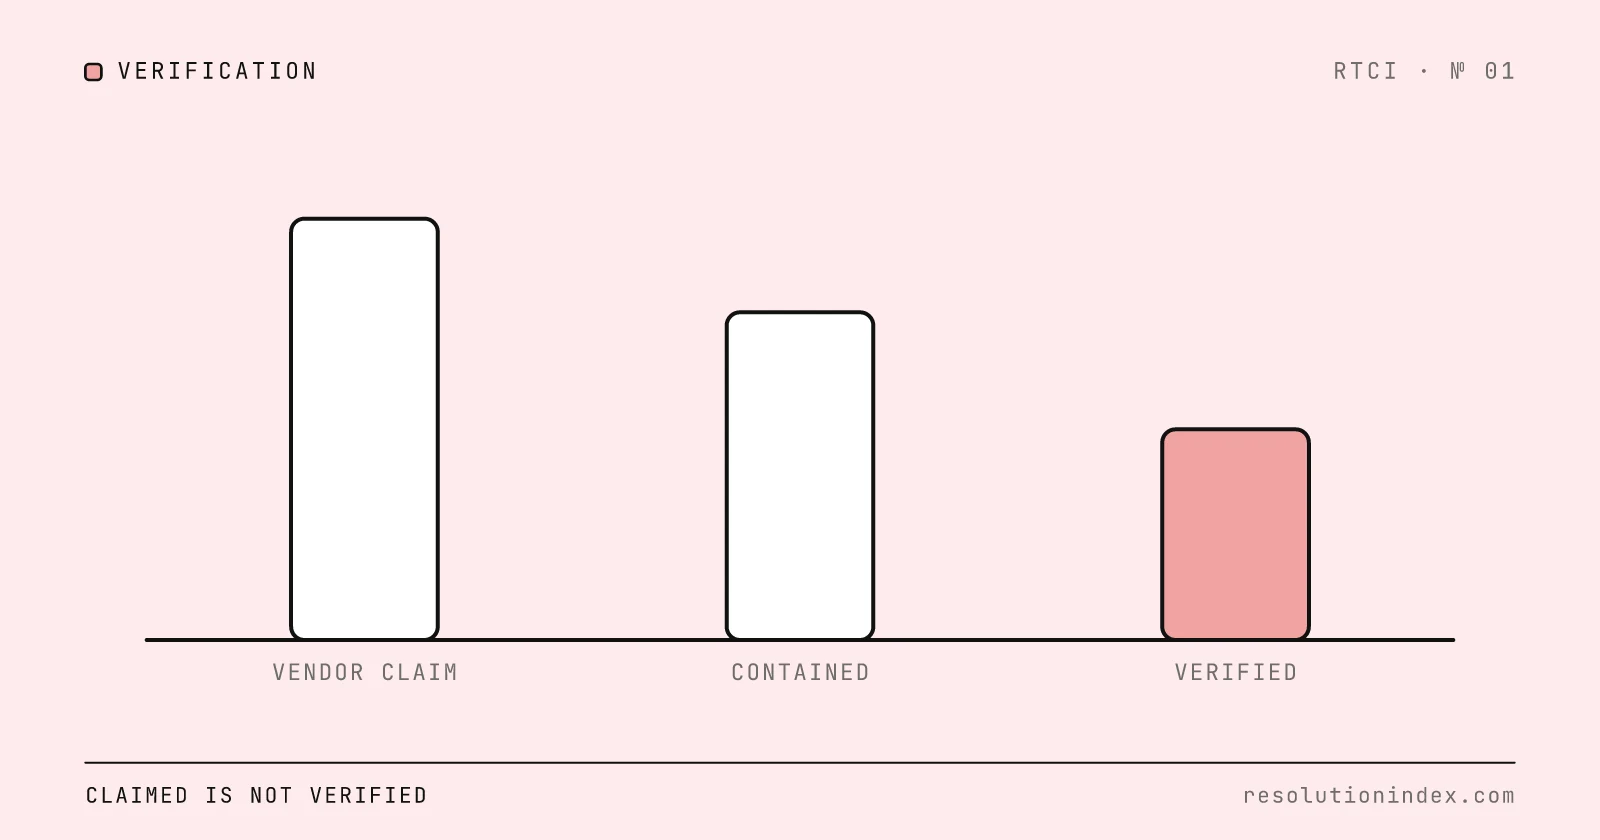
See how AI support vendors blur resolution, containment and deflection, how RTCI discounts each claim, and the five questions to ask before you compare two rates.
CSAT vs NPS (and CES): Which Score to Track for AI-Resolved and Human Support Tickets
What CSAT, NPS and CES each measure, which one to send after AI-resolved, handoff and human tickets, what a good CSAT score really means, and how many responses each group needs before a gap is real.
AI Support Cost Per Resolution by Industry (2026)
How fully loaded cost per verified resolution changes by industry, built from BLS wage data for customer service representatives, published AI pricing and stated assumptions you can replace with your own.