Published Aug 11, 2026 · Updated Nov 19, 2026 · 7 min read
AI Support ROI One-Pager for Finance
A finance-ready AI support business case on one page: baseline cost, AI cost per verified resolution, implementation, payback and three-year NPV, with every input shown.
 Written by Andrew Hall, Editor
A finance-ready AI support business case fits on one page. It compares what a human-resolved ticket costs today with the AI cost per verified resolution, counts the tickets that still need a human, adds implementation, and reports annual savings, payback and three-year NPV. Five inputs drive it. In the worked example below (10,000 tickets a month, Intercom Fin at $0.99 per outcome), the base case saves about $490,000 a year, but only if human headcount actually falls as the AI takes volume.
Why does finance need a one-pager instead of a vendor deck?
A vendor deck sells a resolution rate. Finance needs one auditable sheet that shows how the deployment changes the P&L, with every number traceable to a source or an assumption.
AI support prices are hard to compare because vendors bill different units. Intercom Fin lists $0.99 per outcome. Freshdesk Freddy gives 500 free AI Agent sessions once per account, then charges $49 per 100. Zendesk includes AI agents in every plan with 5 to 10 automated resolutions per agent per month, then bills further Verified resolutions at $1.50 committed or $2.00 pay-as-you-go. AI customer support pricing models compared explains how to line these up.
Vendor ROI calculators also tend to start from the vendor's own resolution rate and treat escalations as free. A one-pager built on cost per verified resolution uses one definition of "resolved" for the baseline, the quote and the forecast. If the deal still wins on conservative inputs, it is a good deal. If it only wins on the vendor's numbers, finance has found the risk before signature.
What are the five numbers that matter?
1. Baseline human cost per ticket. This is the fully loaded monthly cost of an agent divided by tickets that agent closes. Start from public wage data. The U.S. Bureau of Labor Statistics puts the median wage for customer service representatives at $21.53 an hour, or $44,770 a year, in May 2025 (BLS Occupational Outlook Handbook). In BLS's June 2026 Employer Costs for Employee Compensation release, wages are 70.0% of total compensation for private-industry workers, so salary alone leaves out about 30% of employer cost.
Worked from those figures: $44,770 ÷ 0.70 = $63,957 a year, or about $5,330 a month in wages and benefits. The 70% share is an all-occupation average, not a figure for support agents. Software seats, supervision, facilities and training come on top; this article assumes they add 20%, giving about $6,400 per agent per month. Replace both the wage and the 20% with your own payroll and overhead data; the support cost per ticket calculator does this from your headcount, salaries, tooling and overhead. At 714 tickets per agent per month, $6,400 is $8.96 per ticket.
2. AI cost per verified resolution (CPVR). Total AI spend, fixed and variable, divided by tickets the AI resolves with no human handoff and no re-contact within 72 hours. The 72-hour window matters because a ticket closed on Friday that reopens on Monday was not resolved. Where an input is an estimate, label it; RTCI's YourGPT figure, for example, is ~$0.13 (est.) per resolution at the 90% rate from RTCI's November 2026 test. The full method is in Cost Per Verified Resolution: A New Framework, and the Cost per Verified Resolution Calculator runs it.
3. Verified resolution rate. The share of tickets the AI resolves that stay resolved for 72 hours. Do not use the vendor's claim in the base case. RTCI discounts vendor claims to a realistic range: Intercom Fin claims a 76% average across its customers, and RTCI uses a realistic 56–66%. Across the index, realistic rates run from 27–37% for Gorgias AI to 90% for YourGPT in RTCI's November 2026 test. Better still, use your own re-contact data: if 18% of AI-closed tickets reopen within three days, your verified rate is 82% of the billed rate.
4. Escalation tax. A ticket the AI attempts and then hands off is paid for twice: the AI attempt and the human who fixes it. Worked example: 10,000 tickets, 30% escalated (3,000), a $0.60 AI attempt, and an assumed $9 to close an escalated ticket against $8 for a ticket that goes straight to a human. Each escalated ticket costs $9.60 instead of $8.00, so the tax is 3,000 × $1.60 = $4,800 a month on top of the AI bill. The AI Escalation Cost Calculator runs this with your numbers.
5. Implementation and tuning. Setup, knowledge-base work, integrations, security review and ongoing content upkeep. RTCI has no independent data on these, so get them quoted and treat them as assumptions. This article uses $15,000 one-time and $6,000 a year. If tuning pushes payback past 18 months, the case needs more volume or a higher resolution rate.
How should the spreadsheet be laid out?
Use three blocks: inputs, model and outputs. Keep inputs in their own cells with a note on where each came from.
| Input | Worked example | Source |
|---|---|---|
| Monthly tickets | 10,000 | Helpdesk history or forecast |
| AI billed outcomes as a share of tickets | 65% | Vendor quote or pilot |
| Re-contact rate within 72 hours | 18% | Internal helpdesk data |
| AI price per billed outcome | $0.99 | Intercom Fin pricing |
| AI platform or seat cost per month | $0 | Fin on an existing helpdesk (50-outcome minimum is exceeded) |
| Fully loaded agent cost per month | $6,400 | BLS median wage ÷ 0.70, plus an assumed 20% overhead |
| Human cost per ticket | $8.96 | 14 agents × $6,400 ÷ 10,000 tickets |
| Implementation (one-time) | $15,000 | Assumption; replace with quotes |
| Annual tuning and maintenance | $6,000 | Assumption; replace with quotes |
The model block needs these formulas:
- Verified resolutions a month = tickets × billed-outcome rate × (1 − re-contact rate)
- Annual AI variable cost = tickets × billed-outcome rate × price per outcome × 12 (use verified resolutions instead if the vendor bills only verified ones)
- Annual residual human cost = (tickets − verified resolutions) × human cost per ticket × 12
- Annual run-rate cost = AI variable + AI fixed + residual human + tuning
- Annual savings = baseline human cost − annual run-rate cost
- Payback (months) = implementation ÷ (annual savings ÷ 12)
- AI CPVR = (AI variable + AI fixed + tuning + implementation) ÷ annual verified resolutions
The outputs block is the one-pager: AI CPVR, human cost per ticket, annual net savings, payback, three-year NPV at your hurdle rate, and the volume at which savings turn positive. Under the numbers, add one paragraph naming the assumption that would flip the result.
Worked example: 10,000 tickets a month on Intercom Fin
Baseline: 14 agents × $6,400 = $89,600 a month, or $1,075,200 a year, for 10,000 tickets. That is $8.96 per ticket.
AI: Fin produces 6,500 billed outcomes a month (65%). Fin's outcome also covers handoffs and routings, so treat 65% as billed events, not resolutions. 18% re-contact within 72 hours, leaving 6,500 × 0.82 = 5,330 verified resolutions (53.3% of tickets). Annual AI cost: 6,500 × $0.99 × 12 = $77,220.
Residual human work: 10,000 − 5,330 = 4,670 tickets a month × $8.96 × 12 = $502,118.
Run rate: $77,220 + $502,118 + $6,000 tuning = $585,338 a year. Savings: $1,075,200 − $585,338 = $489,862 a year, or $474,862 in year one after the $15,000 implementation. Payback: $15,000 ÷ ($489,862 ÷ 12) = 0.37 months. Three-year NPV at 10%, with implementation at month zero: about $1.20 million. AI CPVR in year one: ($77,220 + $6,000 + $15,000) ÷ (5,330 × 12) = $1.54.
The large saving rests on one assumption: residual human cost falls in line with ticket volume, from 14 agents to about 6.5. If headcount stays at 14, the AI adds $98,220 of cost in year one and saves nothing. That is the risk note for this one-pager.
Which scenarios should finance run?
Run three cases with the same formulas. Only the billed-outcome rate and re-contact rate change.
| Case | Billed outcomes | Re-contact | Verified resolutions | Annual savings | Year-one AI CPVR | 3-year NPV at 10% |
|---|---|---|---|---|---|---|
| Conservative | 55% (5,500) | 18% | 4,510 | $413,575 | $1.60 | ~$1.01M |
| Base | 65% (6,500) | 18% | 5,330 | $489,862 | $1.54 | ~$1.20M |
| Optimistic | 75% (7,500) | 10% | 6,750 | $630,660 | $1.36 | ~$1.55M |
Put the base case on the one-pager and bring the conservative case to the board. The optimistic case is a goal, not a budget. All three assume headcount shrinks with volume.
Definition gaming. If the contract bills handoffs or silences as outcomes, the AI bill stays flat while human work grows. Get a written definition that matches the 72-hour verified standard.
Usage spikes. Metered bills rise with volume. Freshdesk bills $49 per 100 AI sessions once the 500 one-time free sessions are used, so a launch or outage month costs more. Negotiate a cap or volume band.
Headcount inertia. If the team stays the same size for coverage or quality reasons, the savings do not appear. Tie approval to a headcount plan by quarter.
Drift. Answers go stale as products and policies change. Keep the tuning line in every year of the model.
What goes on the checklist before it reaches the CFO?
- Baseline sourced. Agent cost built from payroll or a cited wage source, with the loading shown.
- Definition agreed. "Resolved" means no human handoff and no re-contact within 72 hours, in writing from the vendor.
- CPVR calculated with the CPVR calculator.
- Escalation tax added with the escalation calculator.
- Pricing model mapped. Seat, resolution and usage components separated, per pricing models compared.
- Off-meter costs included. Implementation, integration, knowledge base, security review and tuning.
- Three scenarios run, with the conservative case well below the vendor claim.
- Headcount plan attached, by quarter.
- Payback and NPV shown at the company's hurdle rate.
- Risk note written: the one assumption that would turn the ROI negative.
Change log
- Replaced the unsourced $4,500–$7,500 agent cost range with a BLS-derived figure and a stated overhead assumption, removed unsourced third-party cost statistics, recomputed the worked example and scenarios, and updated Zendesk and Freshdesk pricing to the RTCI index.
- Published.
Read next
Keep reading
Picked for this article: the pieces it cites and the ones that answer the next question buyers usually ask.
Most related
Cost Per Verified Resolution: A New Framework
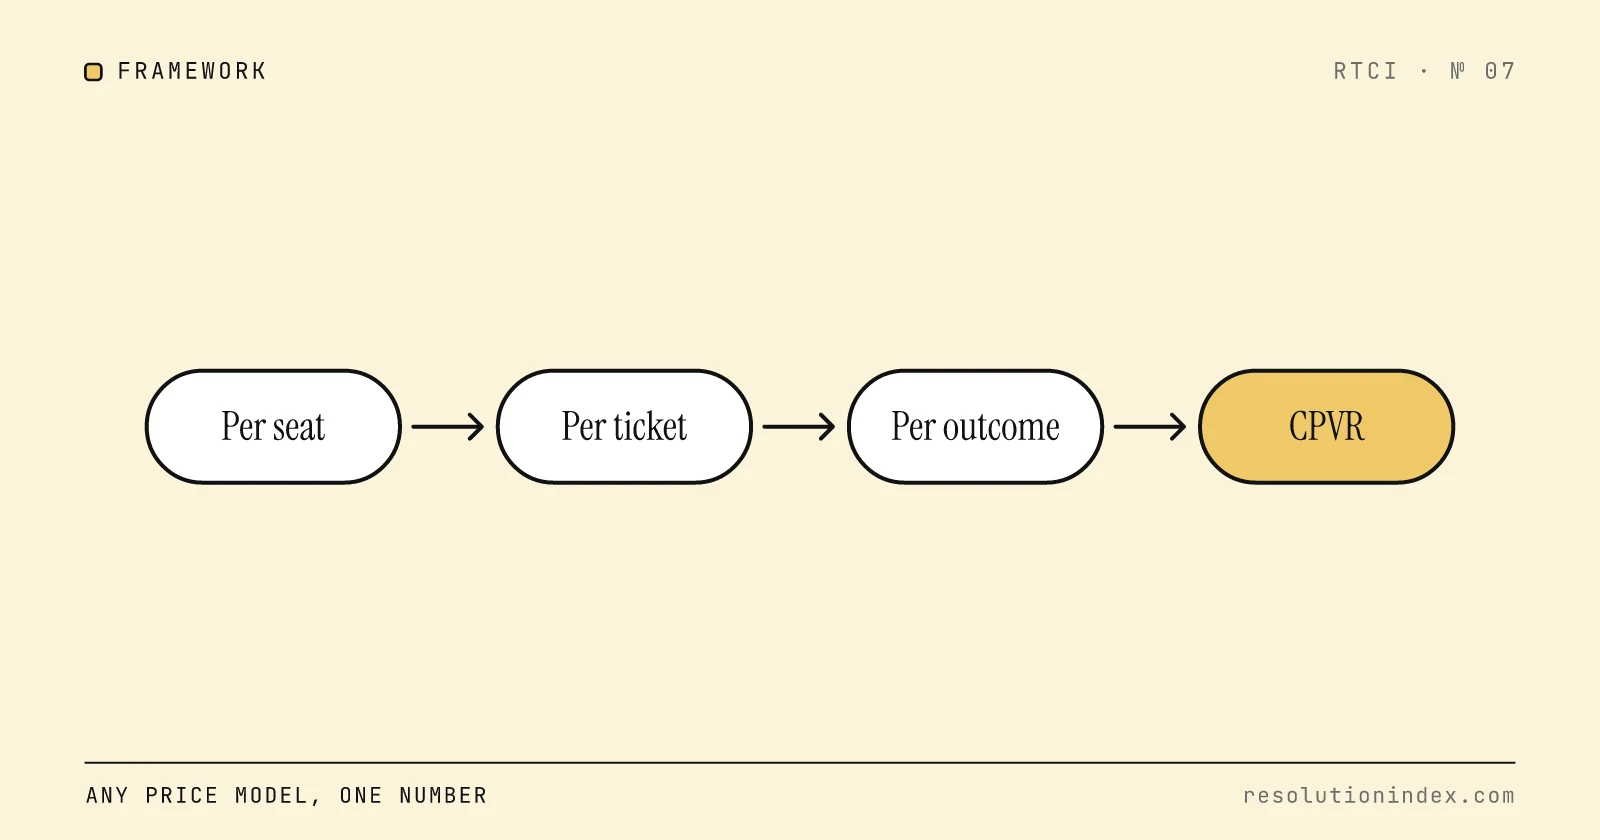
Per-seat, per-ticket, and per-resolution pricing models all produce different numbers for the same underlying cost. RTCI's three-layer cost model normalizes any vendor's pricing into a single comparable metric: cost per verified resolution.
AI Customer Support Pricing Models Compared: Per-Seat, Per-Resolution, and Usage
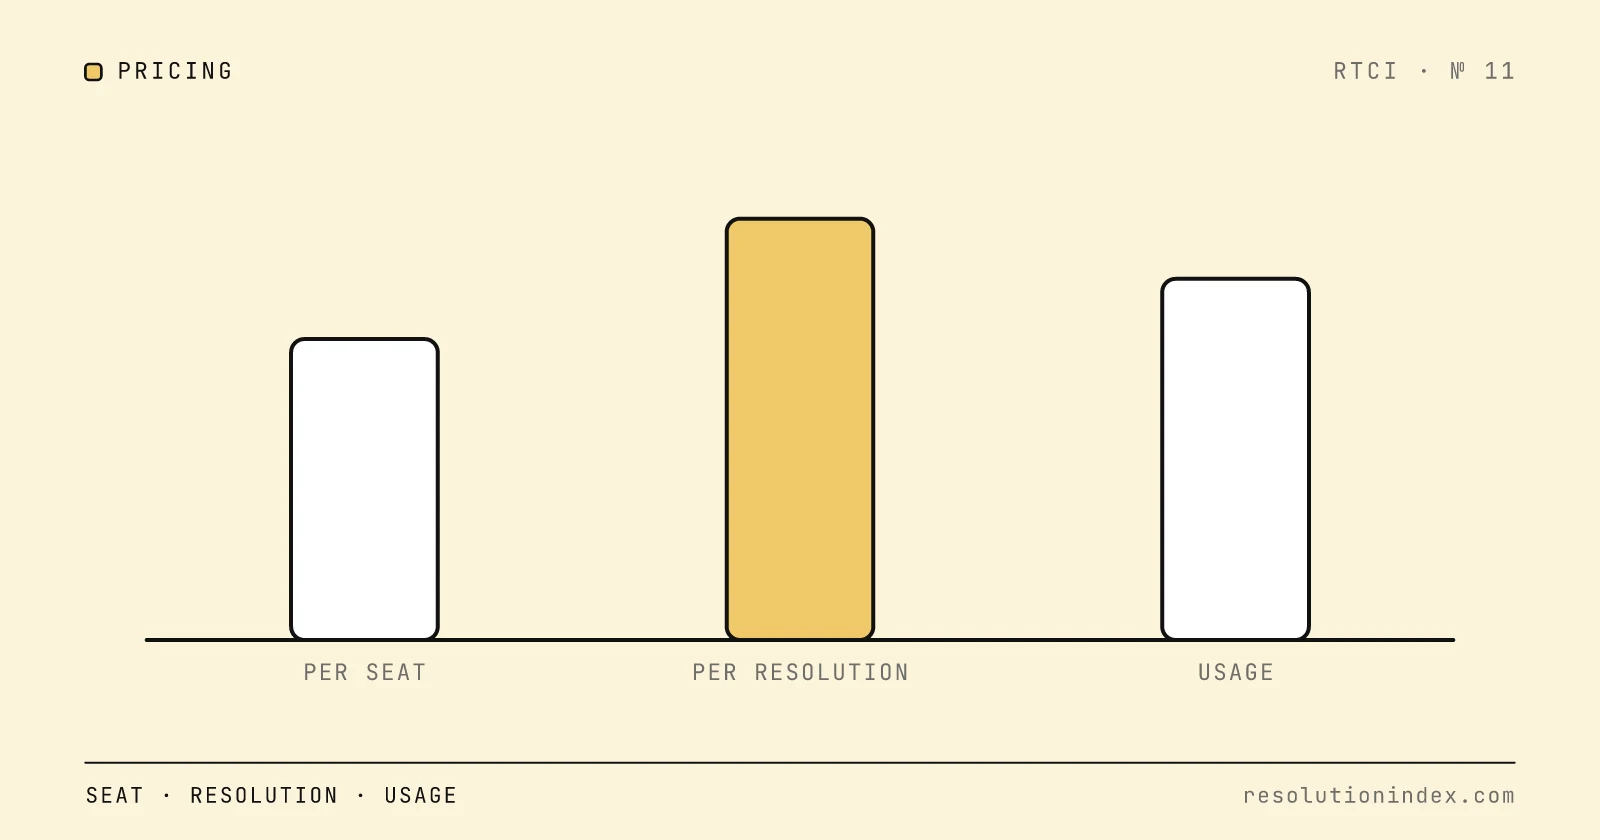
AI support vendors price by seat, by resolution or by usage. A worked example at 10,000 conversations a month shows the same 5,000 resolutions costing $874 to $7,200 depending on the price card.
Best AI Support Platforms for Enterprise (2026)
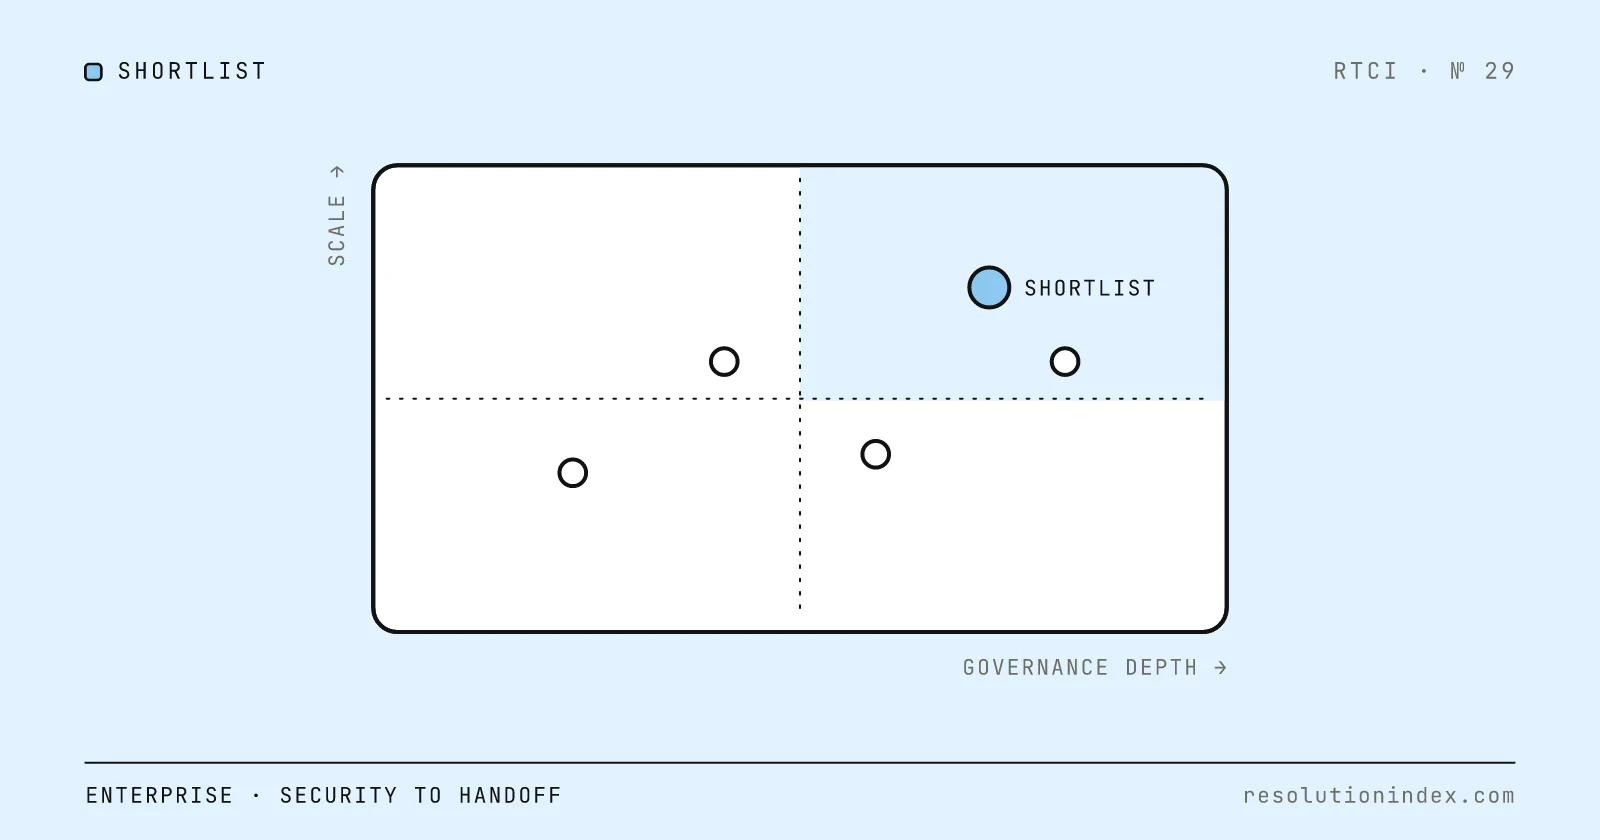
Enterprise shortlist: Salesforce Agentforce, Zendesk AI, Intercom Fin, Decagon, Sierra, Cognigy, and Kore.ai compared on security, deployment options, RTCI score, cost per resolution, and contract terms. Includes a copyable RFP scorecard.
Best AI Support Platforms for Mid-Market Companies (2026)
Mid-market shortlist: Intercom Fin, Freshdesk Freddy, Zendesk AI, DevRev, and YourGPT compared on bill predictability, 30–90 day implementation, and cost per verified resolution, with each vendor’s RTCI score and published price.
Decagon vs Sierra: Enterprise AI Support Comparison (2026)
How Decagon and Sierra differ on pricing model, channels and operating model, what each scored in RTCI's November 2026 test, and what each costs per resolution at three volumes, with the math shown.